

Published: 12 May 2017
Sales in total trade grew by 7.9 per cent year-on-year in March
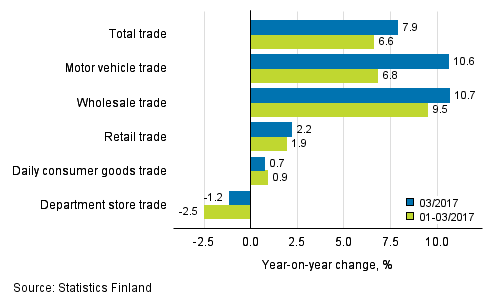
According to Statistics Finland, sales in total trade increased by 7.9 per cent in March from March 2016. Among trade industries, wholesale trade and motor vehicle trade grew most. Sales in wholesale trade increased by 10.7 per cent and in motor vehicle trade by 10.6 per cent year-on-year. Sales in retail trade increased by 2.2 per cent in March year-on-year. Among retail trade industries, daily consumer goods sales grew by 0.7 per cent, whereas sales in department stores contracted by 1.2 per cent from March 2016.
Annual change in turnover in trade industries, % (TOL 2008)
Sales volume of total trade increased by 4.3 per cent in March from the year before
The volume of retail trade sales grew by 2.4 per cent in March from March 2016. The sales volume in wholesale trade went up by 4.4 per cent and in motor vehicle trade by 10.5 per cent from one year ago. Thus, sales volume increased in total trade by 4.3 per cent compared with March 2016.
The volume index of sales is calculated by removing the effect of price changes from the value index series.
Retail trade sales grew by 1.9 per cent in the first quarter
In the January to March period, sales increased by 1.9 per cent in retail trade and by 9.5 per cent in wholesale trade compared to January to March 2016. Sales in motor vehicle trade grew by 6.8 per cent over the same period. Sales in total trade increased by 6.6 per cent in the first quarter from January to March 2016.
The reported annual changes in trade sales and sales volumes are not seasonally or trading day adjusted, which means that the effects of public holidays are not considered. In March, the development of sales was partly due to Easter being in April this year, while last year it was in March. The fact that Easter occurs in different months is in particular visible in the sales development of food during March and April.
Changes in the Tax Administration's self-assessed tax data have not so far had an effect on the data of turnover indices
The effects of the changes in the Tax Administration's self-assessed tax data have been analysed in Statistics Finland’s turnover indices. Based on the analyses, the changes have thus far not been found to have significant effects on enterprises’ VAT reporting in terms of statistics production. More information about this in Changes in the periodic tax return data used in turnover indices .
Source: Turnover of trade, Statistics Finland
Inquiries: Milka Suomalainen 029 551 2912, Seija Karttunen 029 551 2741, palvelut.suhdanne@stat.fi
Director in charge: Mari Yl�-Jarkko
Publication in pdf-format (251.5 kB)
- Tables
-
Tables in databases
Pick the data you need into tables, view the data as graphs, or download the data for your use.
Appendix tables
- Figures
- Revisions in these statistics
-
- Revisions in these statistics (12.5.2017)
Updated 12.05.2017
Official Statistics of Finland (OSF):
Turnover of trade [e-publication].
ISSN=1799-0939. March 2017. Helsinki: Statistics Finland [referred: 19.4.2024].
Access method: http://www.stat.fi/til/klv/2017/03/klv_2017_03_2017-05-12_tie_002_en.html