

Published: 12 November 2020
Turnover in trade decreased by 0.7 per cent in September
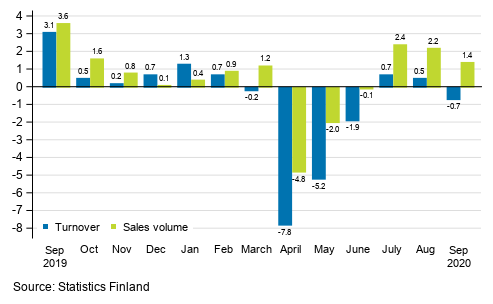
According to Statistics Finland, turnover in total trade adjusted for working days contracted in September by 0.7 per cent from September 2019. Turnover decreased in all main industries of trade except for retail trade. In total trade, the working day adjusted volume of sales, from which the impact of prices has been eliminated, rose further by 1.4 per cent in September. The more favourable development in sales volume than in turnover is explained by a drop in prices.
Annual change in working day adjusted turnover and sales volume in total trade (G), %
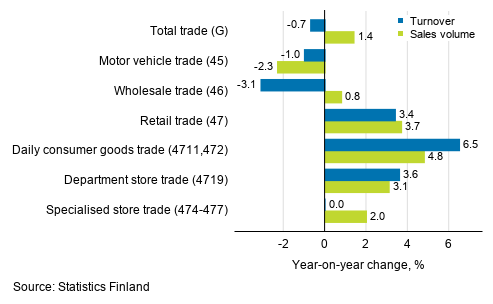
In wholesale trade, working day adjusted turnover still remained subdued, as turnover fell by 3.1 per cent from last year's September. In turn, sales volume in wholesale trade went up by just under one per cent from one year ago. In September, turnover adjusted for working days in motor vehicle trade fell by exactly one per cent and the volume of sales adjusted for working days by 2.3 per cent. Working day adjusted turnover in retail trade grew by 3.4 per cent in September compared to the previous year’s September. The volume of sales also developed favourably, as the growth amounted to 3.7 per cent year-on-year. Among retail trade industries, daily consumer goods and department store trade grew most. In September, the working day adjusted turnover of daily consumer goods trade was 6.5 per cent and that of department store trade 3.6 per cent higher than one year earlier. In specialised store trade, turnover remained on level with the previous year, but the volume of sales grew in September by exactly two per cent compared with the previous year.
Annual change in working day adjusted turnover and sales volume in industries of trade, September 2020, % (TOL 2008)
Turnover and sales volume remained on level with the previous month
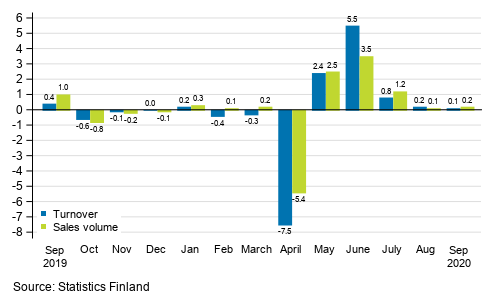
The development of seasonally adjusted turnover in total trade compared with the previous month has been positive since the plunge in April 2020. In September, seasonally adjusted turnover in total trade grew slightly by 0.1 per cent compared to August. Sales volume grew by 0.2 per cent during the same period. In August, turnover and sales volume also remained on level with the previous month, as turnover grew by 0.2 per cent and sales volume by 0.1 per cent from July.
Change in seasonally adjusted turnover and sales volume in total trade (G) from the previous month, %
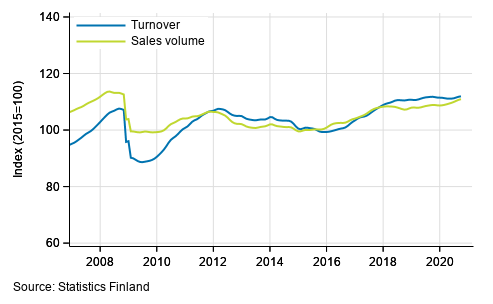
Trend of turnover and sales volume in total trade
The calculation of indices of turnover of trade is based on the Tax Administration’s data on self-assessed taxes, which are supplemented with Statistics Finland’s sales inquiry. The volume index of sales is calculated by removing the effect of price changes from the value index series.
The factors caused by the variation in the number of weekdays are taken into account in adjustment for working days. This means taking into consideration the lengths of months, different weekdays and holidays. In addition, seasonal variation is eliminated from seasonally adjusted series, on account of which it makes sense to compare observations of two successive months as well.
The data for the latest month are preliminary and they may become significantly revised particularly on more detailed industry levels in coming months.
Source: Turnover of trade, Statistics Finland
Inquiries: Suvi Kiema 029 551 3509, Reetta-Maria Salokannel 029 551 3657, palvelut.suhdanne@stat.fi
Head of Department in charge: Mari Yl�-Jarkko
Publication in pdf-format (295.9 kB)
- Tables
-
Tables in databases
Pick the data you need into tables, view the data as graphs, or download the data for your use.
Appendix tables
- Revisions in these statistics
-
- Revisions in these statistics (12.11.2020)
Updated 12.11.2020
Official Statistics of Finland (OSF):
Turnover of trade [e-publication].
ISSN=1799-0939. September 2020. Helsinki: Statistics Finland [referred: 20.4.2024].
Access method: http://www.stat.fi/til/klv/2020/09/klv_2020_09_2020-11-12_tie_002_en.html