

1. Persons who voted in the Presidential elections 2018
This review examines persons entitled to vote and those who voted in the Presidential election 2018 according to various background factors. The data on persons entitled to vote and those who voted derive from the voting register of the Election Information System of the Ministry of Justice. The unit-level background data are based on Statistics Finland’s data, such as population, employment and family statistics, and the Register of Completed Education and Degrees. The groups under examination are, on the one hand, all persons entitled to vote in the Presidential election 2018 and advance voters and, on the other hand, persons entitled to vote and those who voted in the voting districts where an electronic voting register was in use in the Presidential election 2018.
The electronic voting register enables examination of voting turnout also in terms of votes cast on the election day. Data that contain all who voted provides a complete picture of voting turnout as they can reliably help take into account those who did not vote. This is not possible only for the data containing advance voters. In this review, advance voters refer to all persons that voted in advance throughout the country and all who voted refer to both advance voters and those who voted on the election day in the above-mentioned areas.
It should be noted that the data presented in the review concerning all who voted do not cover the entire country or all persons entitled to vote. In this review, all who voted refer to the actual event of voting in those districts on which data were available. The data presented in this review have not been edited in any way, for example, by weighting the data based on background factors, but the breakdowns are presented as they are in the data. In other words, the data presented on all who voted in a particular area only apply to the municipalities, voting districts and persons entitled to vote for which data were available. The analyses presented in the review naturally concern the first election round of the Presidential election.
Analysed data
When examining the analyses of the review it should be noted that the analyses include two separate but partly overlapping voter groups. The following terms are used for these voter groups in the text, tables and figures of the review:
-
Advance voters that cover all persons that voted in advance in the elections
-
All who voted in the areas that cover both advance voters and persons who voted on the election day (that is, all who voted) in the voting districts that used the electronic voting register
The voter groups used in the review are not mutually exclusive. The advance voters of the entire country also include the persons entitled to vote who voted in advance in the above-mentioned areas. All who voted in the areas, in turn, also include all persons that voted in advance in those particular areas. Thus the group “advance voters” depicts, just like the name suggests, persons entitled to vote who voted in advance in the entire country, and the group “all who voted in the areas” covers persons who voted on the election day and in advance in a limited number of voting districts.
The data of the review are limited to persons entitled to vote living in Finland. There were 4,246,803 persons entitled to vote resident in Finland in the Presidential election 2018. Of these persons entitled to vote, 1,559,488, or 36.7 per cent of all persons entitled to vote, voted in advance. The voting districts where data on voting on the actual election day are available had 1,625,579 persons entitled to vote. So complete voting data are available for 38.3 per cent of persons entitled to vote.
Unit-level background factors could not be linked to all persons entitled to vote so such cases were excluded from the data. Thus, the data that were used for the whole country had 4,240,799 and the examined areas had 1,623,953 persons entitled to vote. It should be noted that in terms of background variables used in an individual analysis, these numbers may be smaller than the figures mentioned above depending on how extensively the background variables could be linked to the persons entitled to vote. In practice, this is visible, for example, in that the distributions presented in the figures and tables may vary slightly by background variable.
Data coverage
The voting districts and municipalities for which all voting data were received are not divided entirely equally on the level of the whole country. Data on voting on the actual election day were available from 134 municipalities, from 79 municipalities completely, that is, from all voting districts and for 55 municipalities from some of the voting districts.
Voting data from the election day were available from all constituencies in Mainland Finland. However, the coverage of the data varies by constituency. The most comprehensive data were available from the constituency of Central Finland, 77.7 per cent of persons entitled to vote in the constituency. Data were also more comprehensive than for the entire country in the constituencies of Oulu (70.9% of persons entitled to vote), Lapland (69.8%), Uusimaa (45.6%), Satakunta (41.9%), Pirkanmaa (40.4%) and Varsinais-Suomi (39.2%). The coverage for election day voting data was lowest in the Helsinki constituency where data were available only for two voting districts and for 1.4 per cent of persons entitled to vote. In other words, the Helsinki constituency is clearly under-represented in the available data. (See Appendix table 1)
Appendix table 2 examines the background factors of persons entitled to vote in the entire country and in the areas with complete voting data. In the Presidential election 2018, the average age of persons entitled to vote was 50.8. In this respect, the persons entitled to vote in certain areas do not considerably differ from all persons entitled to vote. Of all persons entitled to vote, men represented 48.6 per cent in the whole country, as many as in the areas in relative terms.
The median income of persons entitled to vote in the whole country was slightly higher than that of persons entitled to vote in the areas. The difference is around EUR 400 per year. The income level is lower than average for the whole country especially in the voting districts of such municipalities for which complete data were not obtained.
As regards the level of education, the examined areas do not essentially differ from the whole country. In the whole country, persons entitled to vote were, on average, slightly more highly educated than in the examined areas with the electronic voting register. The difference is, in particular, visible in the highest examined group of education, those with higher tertiary level or doctorate level education, of whom there were 1.2 percentage points more in the entire country than in the areas. Particularly as regards education, the under-representation of the constituency of Helsinki has effects on the distributions of the data.
There are small differences between all persons entitled to vote and persons entitled to vote living in the areas when it comes to main type of activity categories. There were slightly more employed persons (0.6 percentage points) in the whole country than in the areas and correspondingly, the areas had more students (0.6 percentage points). In turn, the number of pensioners was, in relative terms, equal in the areas and in the whole country. The areas had 1.5 percentage points more Finnish-speaking persons entitled to vote than the entire country. In contrast, the share of persons with Finnish background was 0.4 percentage points higher in the areas than in the whole country. There was no significant difference in the support for the presidential candidates between the whole country and the areas.
The factors presented in this Section and in Appendix tables 1 and 2 should be considered if the data obtained on all who voted in the areas with an electronic voting register are to be generalised to relate to all persons entitled to vote.
Age and sex
In the first round of the Presidential election in 2018, a total of 1,559,488 persons entitled to vote resident in Finland voted in advance, which represents 36.7 per cent of all persons entitled to vote living in Finland. The advance voting percentage reported by Statistics Finland is 52.5. The advance voting percentage is derived by calculating the share of advance voters among those having voted. In this review, persons who voted are examined in relation to persons entitled to vote, so the percentages given are lower than the advance voting percentage.
In the voting districts where all voting data were available, a total of 1,126,333 persons entitled to vote cast their vote, which was 69.3 per cent of the persons entitled to vote in the areas. In these areas, 37.7 per cent of persons entitled to vote voted in advance and 31.5 per cent voted on the election day.
Age clearly has an impact on voting. The share of advance voters in the whole country among persons entitled to vote exceeds 30 per cent at the age of 48 , after which the share grows faster than earlier. Advance voting was most common among persons aged 74, of whom 59.0 per cent voted in advance. The share of advance voters starts to go down after the age of 74, the share of advance voters falls to under 30 per cent among persons aged 95 . (Figure 1.)
Figure 1. Share of those who voted among persons entitled to vote by age in the Presidential election 2018, %
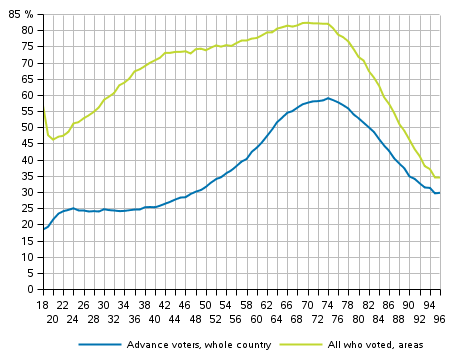
The share of all who voted among persons entitled to vote in those voting districts where voting data on the election day were also obtained gives a more comprehensive picture of advance voting. The voting percentage of persons who had reached the voting age of 18 by the voting day of the Presidential election 2018 was 56.9 per cent in the areas. However, the voting percentage drops to 46.2 per cent in the group of persons aged 20. After this, the voting percentage grows fairly evenly to 73.0 per cent in the age group of those aged 42, after which the growth is slower. The voting percentage is at its highest in the group of persons aged 70 (82.3%). For persons aged over 74, the voting percentage goes down relatively quickly but drops below the level for those aged 20 only at the age of 90. (Figure 1)
Women voted more actively than men both in advance in the whole country and on the election day and in advance in the areas as well apart from the oldest examined age group. In the whole country, 40.0 per cent of women entitled to vote voted in advance, nearly seven percentage points more than men.
The voting percentage that takes into account all persons who voted is also higher for women in the areas. In the areas, 72.3 per cent of women voted, which was around six percentage points higher than men. Examined by age group, women voted more actively than men in all age groups except for persons aged 75 or over. At the other end of the age distribution, the voting turnout of young people aged 18 to 19 entitled to vote was slightly over four percentage points higher than in the 20 to 24 age group. As can be seen in Figure 1, voting turnout in the areas that takes account of voting by young people on the election day and in advance falls soon after attaining the voting age. (Table 1)
Table 1. Share of advance voters in the whole country and all who voted in the areas among persons entitled to vote by sex and age in Presidential election 2018, %
| Age group | Total | Men | Women | |||
| Advance voters, whole country |
All who voted, areas |
Advance voters, whole country |
All who voted, areas |
Advance voters, whole country |
All who voted, areas |
|
| Total | 36.7 | 69.3 | 33.2 | 66.1 | 40.0 | 72.3 |
| 18-19 | 18.9 | 52.3 | 14.8 | 46.3 | 23.1 | 58.3 |
| 20-24 | 23.7 | 48.1 | 18.8 | 41.8 | 28.9 | 54.9 |
| 25-34 | 24.2 | 57.4 | 21.2 | 52.6 | 27.4 | 62.6 |
| 35-44 | 25.6 | 70.0 | 23.2 | 66.0 | 28.1 | 74.2 |
| 45-54 | 31.8 | 74.3 | 28.6 | 70.9 | 34.9 | 77.6 |
| 55-64 | 43.4 | 77.7 | 39.6 | 74.9 | 47.1 | 80.5 |
| 65-74 | 56.5 | 81.7 | 53.3 | 80.0 | 59.4 | 83.3 |
| 75- | 49.3 | 66.8 | 51.0 | 71.0 | 48.2 | 64.1 |
Main type of activity, education and family status
Measured by main type of activity, employed persons voted most in advance in the Presidential election 2018 in the whole country, making up 44.1 per cent of all advance voters. The number of pensioners was almost the same among advance voters (43.8 per cent). Among advance voters, the number of employed persons was lower and that of pensioners higher than among all persons entitled to vote. In other groups of main type of activity, the share of advance voters was relatively smaller than among all persons entitled to vote. (Figure 2)
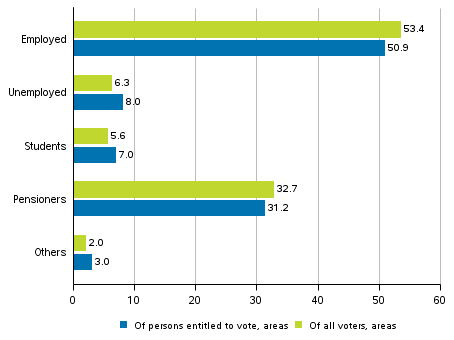
Among all employed and pensioners who voted in the areas, the share of the group was bigger than the corresponding share of the groups among all persons entitled to vote. By contrast, the share of those who voted belonging to the unemployed, students or other main type of activity in the areas was below the relative size of the groups among all persons entitled to vote. (Figure 3.)
Figure 2. Persons entitled to vote and advance voters in the whole country by main type of activity in the Presidential election 2018, %
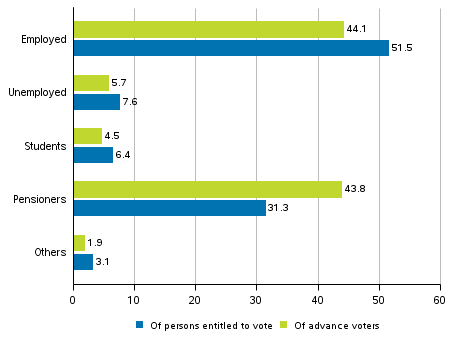
Figure 3. Persons entitled to vote and all who voted in the areas by main type of activity in the Presidential election 2018, %
High education increases the probability of voting. Persons entitled to vote with lowest tertiary or higher education voted in advance in the whole country more than average in the Presidential election. This is also clearly visible for all who voted in the areas, the voting percentage of persons with higher tertiary or doctorate level education was 19.1 percentage points higher than among all persons entitled to vote.
Previously it was noted that age has a clear connection to voting turnout. This is also visible in educational groups in which, in practice, all voting turnout increases with age, apart from the oldest age group, those aged 75 or over. Voting turnout of over 90 per cent is attained for advance voting and voting on the election day among those aged 55 to 74 with at least higher tertiary education and those aged 65 to 74 with lower tertiary education. The effect of age is visible both among advance voters in the whole country and all who voted in the areas. (Table 2)
When interpreting Table 2 it should be noted that lowest tertiary level qualifications decrease in the population and no new qualifications are completed in Finland in this category, so the age structure of the educational group differs clearly from other groups. Lowest tertiary level education covers qualifications above upper secondary level that are not university of applied sciences degrees.
Table 2. Share of advance voters in the whole country and all who voted in the areas among persons entitled to vote by age and level of education in Presidential election 2018, %
| Total | Lower secondary |
Upper secondary |
Lowest tertiary |
Lower tertiary |
Higher tertiary, doctorate |
||
| Total | Advance voters, whole country |
36.7 | 34.2 | 33.6 | 48.9 | 38.4 | 42.1 |
| All who voted, areas |
69.3 | 57.3 | 65.2 | 84.8 | 80.8 | 88.3 | |
| 18-24 | Advance voters, whole country |
22.4 | 16.5 | 25.9 | .. | 45.5 | .. |
| All who voted, areas |
49.2 | 44.0 | 51.9 | .. | 78.0 | .. | |
| 25-34 | Advance voters, whole country |
24.2 | 11.6 | 20.2 | 14.4 | 33.2 | 38.7 |
| All who voted, areas |
57.4 | 29.8 | 51.8 | 38.8 | 74.6 | 83.4 | |
| 35-44 | Advance voters, whole country |
25.6 | 16.0 | 22.7 | 29.3 | 29.1 | 31.9 |
| All who voted, areas |
70.0 | 42.3 | 62.9 | 78.8 | 80.0 | 86.6 | |
| 45-54 | Advance voters, whole country |
31.8 | 22.4 | 30.1 | 36.3 | 34.6 | 36.2 |
| All who voted, areas |
74.3 | 51.9 | 69.1 | 82.8 | 83.5 | 89.1 | |
| 55-64 | Advance voters, whole country |
43.4 | 35.8 | 42.1 | 49.2 | 48.2 | 47.7 |
| All who voted, areas |
77.7 | 64.3 | 74.8 | 85.9 | 87.6 | 90.9 | |
| 65-74 | Advance voters, whole country |
56.5 | 50.5 | 56.2 | 64.6 | 63.8 | 64.0 |
| All who voted, areas |
81.7 | 74.6 | 81.8 | 89.6 | 91.0 | 92.9 | |
| 75- | Advance voters, whole country |
49.3 | 43.5 | 52.5 | 62.3 | 64.7 | 66.2 |
| All who voted, areas |
66.8 | 60.0 | 71.6 | 80.9 | 83.6 | 87.8 | |
The family status of persons who voted is examined by means of limited family status groups. Attention is paid to married or cohabiting couples (partnerships) and those without a family, the number of children and the age of persons entitled to vote.
Those in partnerships voted in the areas clearly more than those without a family, the voting percentage of married or cohabiting couples was over 17 percentage points higher than that of those without a family. The number or age of children does not have a significant effect on the voting turnout of those in partnerships. In turn, the voting turnout of parents of one-parent families remained at 59.1 per cent.
When examining the voting turnout of young people aged 18 to 24, we can see that the voting percentages of those living at home (with their parents) were higher than of those of the same age not belonging to families. Those not belonging to a family include both those living alone and with another person or other persons. The difference in the groups’ voting turnout in the areas was around seven percentage points.
An age group specific examination of all who voted does not significantly change the picture of the effect of family status. As a rule, the voting percentage grows in all family status groups by age, apart from the oldest age group of people aged 75 and over. For the family status, the group “Other” includes those aged over 24 living at home, parents of one-parent families living with their adult child, the institutional population and unclassified persons and those whose family status is unknown. (Figure 4, Table 3)
Figure 4. Share of those who voted among persons entitled to vote by age in certain family status groups in the Presidential election 2018, %
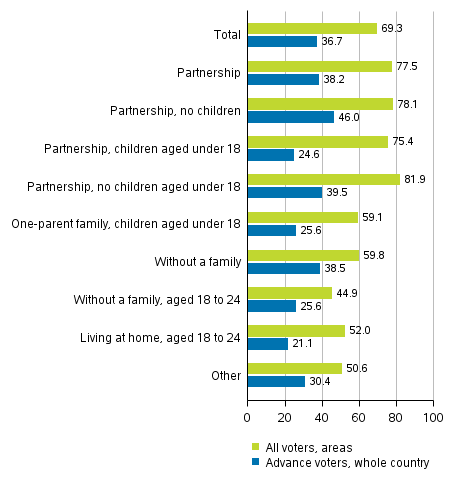
Table 3. Share of advance voters in the whole country and all who voted in the areas among persons entitled to vote by family status in the Presidential election 2018, %
| Total | Partner- ship |
Partner- ship, no children |
Partner- ship, children aged under 18 |
Partner- ship, no children aged under 18 |
One-parent family, children aged under 18 |
Without a family |
Other | ||
| Total | Advance voters, whole country |
36.7 | 38.2 | 46.0 | 24.6 | 39.5 | 25.6 | 38.5 | 30.4 |
| All voters, areas |
69.3 | 77.5 | 78.1 | 75.4 | 81.9 | 59.1 | 59.8 | 50.6 | |
| 18-24 | Advance voters, whole country |
22.4 | 22.1 | 23.5 | 13.0 | .. | 8.5 | 25.6 | 16.3 |
| All voters, areas |
49.2 | 51.2 | 52.3 | 44.1 | .. | 21.6 | 44.9 | 28.8 | |
| 25-34 | Advance voters, whole country |
24.2 | 23.6 | 27.5 | 19.7 | .. | 16.2 | 26.3 | 23.7 |
| All voters, areas |
57.4 | 64.5 | 65.0 | 64.1 | .. | 40.2 | 50.0 | 44.4 | |
| 35-44 | Advance voters, whole country |
25.6 | 24.7 | 29.1 | 23.7 | 24.1 | 25.1 | 28.9 | 27.0 |
| All voters, areas |
70.0 | 75.6 | 69.4 | 77.0 | 67.1 | 61.5 | 56.6 | 46.2 | |
| 45-54 | Advance voters, whole country |
31.8 | 31.0 | 35.0 | 28.2 | 33.1 | 31.2 | 34.2 | 32.3 |
| All voters, areas |
74.3 | 79.9 | 75.9 | 81.8 | 81.5 | 69.5 | 60.9 | 58.4 | |
| 55-64 | Advance voters, whole country |
43.4 | 44.2 | 46.4 | 33.8 | 40.2 | 36.0 | 42.7 | 38.4 |
| All voters, areas |
77.7 | 83.3 | 83.2 | 82.8 | 84.3 | 73.1 | 66.9 | 62.7 | |
| 65-74 | Advance voters, whole country |
56.5 | 58.6 | 59.3 | 41.6 | 50.9 | 48.0 | 53.2 | 44.4 |
| All voters, areas |
81.7 | 86.7 | 87.0 | 81.0 | 83.8 | 77.0 | 72.8 | 61.8 | |
| 75- | Advance voters, whole country |
49.3 | 55.3 | 55.9 | .. | 44.7 | .. | 45.9 | 29.0 |
| All voters, areas |
66.8 | 76.9 | 77.3 | .. | 68.4 | .. | 60.0 | 39.0 | |
Figures 5 and 6 examine the voting turnout of young people aged 18 to 24 in 1-year age groups by sex and family status. Of the family status groups, the figures show the groups living at home and without a family. The limitation helps to examine the effect of the mode of living on young people’s voting turnout. The figures show information on all those belonging to the groups mentioned in the voting districts on which data were available. The data shown include voting on the election day and in advance, information on advance voting in the whole country is thus not presented.
When viewing the data presented in Figures 5 and 6 it should be noted that the family status data of persons entitled to vote are from 2016. In practice, the data were selected around 13 months before the first round of the Presidential election 2018. Persons aged 18 entitled to vote in the 2018 election shown in Figures 5 and 6 were aged 16 to 17 at the time of collecting the family status data, those aged 19 were at the age of 17 to 18 and so on. This inevitably has an effect on the size of the groups, particularly in the youngest 1-year age group. In practice, it can be assumed that these age groups had more persons living alone than in the background data used for the analysis.
It should be noted that especially in the youngest examined 1-year age groups, the share of young persons without a family is small. In the examined family status groups, 3.6 per cent of men aged 18 entitled to vote were without a family as were 7.5 per cent of women. Men’s share rises for those aged 19 to 9.3 per cent and women’s to 15.5 per cent. In the next age group of those aged 20, the population without a family includes 20.1 per cent of men and 34.7 per cent of women.
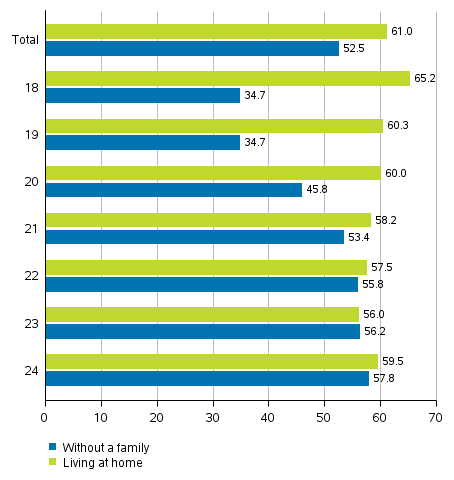
Figure 5 shows that the voting turnout of young men (aged 18 to 20) living at home is significantly higher than among those without a family. For women, the situation is largely similar, although the voting turnout of young women is generally higher than that of men in all age groups (Figure 6). After these ages, the difference between those living at home and those without a family narrows down for both men and women and from the age of 22 onwards the difference is no longer big.
Figure 5. Share of those having voted in the areas among persons entitled to vote, men aged 18 to 24 by family status in the Presidential election 2018, %
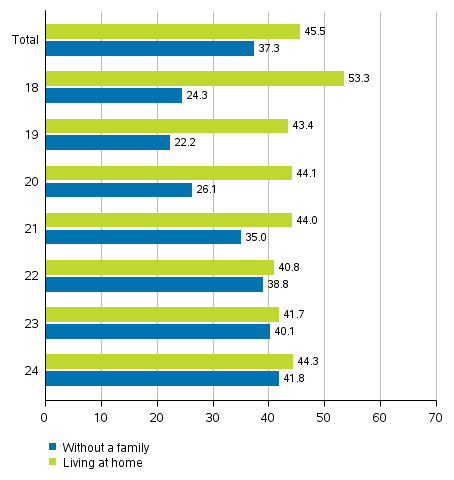
Figure 6. Share of those having voted in the areas among persons entitled to vote, women aged 18 to 24 by family status in the Presidential election 2018, %
Income level
The income level of those who voted and persons entitled to vote is examined with the help of monetary income subject to state taxation. The income data derive from the latest taxation data from 2016. Income subject to state taxation consists of earned income, entrepreneurial income, and other income subject to state taxation, including such as other earned income, pension income, unemployment benefits and other social security benefits. Income subject to taxation does not include such as grants and awards received from the general government, earned income received from abroad under certain conditions, some of social security benefits received from the public sector, and tax-free interest income.
In the data of the review, the income of persons entitled to vote is divided into deciles. Income deciles are derived by arranging persons entitled to vote by income and by dividing the group into ten equal parts. The groups formed in this way each have around 422,000 persons entitled to vote for all persons entitled to vote in the whole country. In the areas from which data were received on voting on the election day as well, the groups have around 161,000 persons entitled to vote each.
For the whole country, income data are missing for 49,351 persons entitled to vote. In the data for the areas containing election day votes, the income level was missing for 17,154 persons entitled to vote. The median income subject to state taxation of all persons entitled to vote was EUR 25,777, in the examined areas the corresponding median income was EUR 25,072. The income subject to state taxation of persons entitled to vote in the whole country belonging to the highest income decile was at least EUR 55,615 and in the examined areas it was EUR 53,805 per year. The income for those belonging to the lowest income decile was at most EUR 8,500 for persons entitled to vote in the whole country and EUR 8,497 per year in the areas. (Table 4)
Table 4. Lowest limits for the income deciles of persons entitled to vote in the Presidential election 2018, EUR
| Decile | All persons entitled to vote |
Persons entitled to vote in areas |
| 1st decile | 0 | 0 |
| 2nd decile | 8,501 | 8,498 |
| 3rd decile | 12,190 | 12,013 |
| 4th decile | 16,105 | 15,903 |
| 5th decile | 20,654 | 20,347 |
| 6th decile | 25,477 | 25,072 |
| 7th decile | 30,270 | 29,774 |
| 8th decile | 35,467 | 34,810 |
| 9th decile | 42,548 | 41,580 |
| 10th decile | 55,615 | 53,805 |
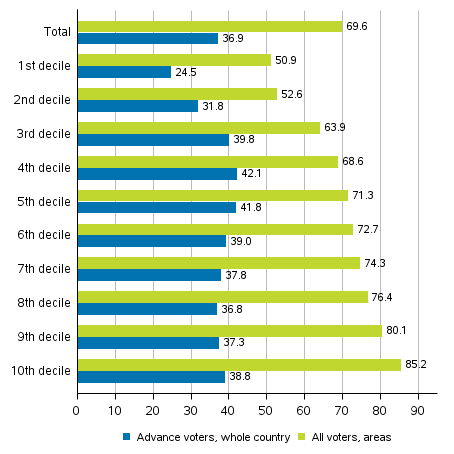
On the level of the whole country, the level of income as a whole does not have much effect on advance voting. In the two lowest deciles, advance voting is relatively lower than in the higher income brackets. Starting from the third income decile, there are no major changes in the rate of advance voting, the share of advance voting in these categories varies from 36.8 to 42.1 per cent of persons entitled to vote. (Figure 7)
When examining all who voted in the areas for which complete voting data were available, the effect of income on voting turnout is considerably more evident. As a rule, voting is more common in higher income groups than in lower income groups. In all, 85.2 per cent of those belonging to the highest income decile voted. In turn, the voting turnout remained at 50.9 per cent in the lowest income decile. Thus, the difference between the voting turnout of the lowest and highest income earners was over 34 percentage points. (Figure 7)
Figure 7. Share of those who voted among persons entitled to vote by income decile in the Presidential election 2018, %
Foreign background
The background of persons entitled to vote and persons who voted is viewed by means of language and origin. Voting turnout for persons with national languages as their native language was higher than for all persons entitled to vote both for advance voters in the whole country and for all who voted in the areas. When examining all who voted in the areas, 0.4 percentage points more of Finnish and Sami speakers and 5.5 percentage points more of Swedish speakers voted compared to all persons entitled to vote.
In the Presidential election, the right to vote is tied to nationality, that is, there are fewer persons speaking other than national language as their native language entitled to vote than in the Municipal elections, for example. Of all persons entitled to vote, 92.3 per cent were Finnish-speaking, 5.3 per cent Swedish-speaking and 2.4 per cent other language speakers. In the areas for which data were available for all who voted, 93.8 per cent spoke Finnish as their native language, 4.2 per cent Swedish and 1.9 per cent other languages. The share of Sami speakers was in both cases 0.03 per cent.
Table 5. Share of advance voters in the whole country and all who voted in the areas among persons entitled to vote by sex and language in the Presidential elections 2018, %
| Sex | Total | Finnish, Sami | Swedish | Other language | ||||
| Advance voters, whole country |
All who voted, areas |
Advance voters, whole country |
All who voted, areas |
Advance voters, whole country |
All who voted, areas |
Advance voters, whole country |
All who voted, areas |
|
| Total | 36.7 | 69.3 | 37.7 | 69.7 | 29.8 | 74.8 | 14.6 | 37.5 |
| Men | 33.2 | 66.1 | 34.1 | 66.4 | 27.0 | 72.4 | 13.8 | 35.5 |
| Women | 40.0 | 72.3 | 41.1 | 72.8 | 32.7 | 77.2 | 15.4 | 39.1 |
The voting turnout of foreign-language speakers was clearly lower than for those speaking national languages. Of all foreign-language speakers entitled to vote in the whole country, 14.6 per cent voted in advance. Correspondingly, among all who voted in the areas, 37.5 per cent of foreign-language speakers voted, which was almost 32 percentage points lower than for all persons entitled to vote. (Table 5)
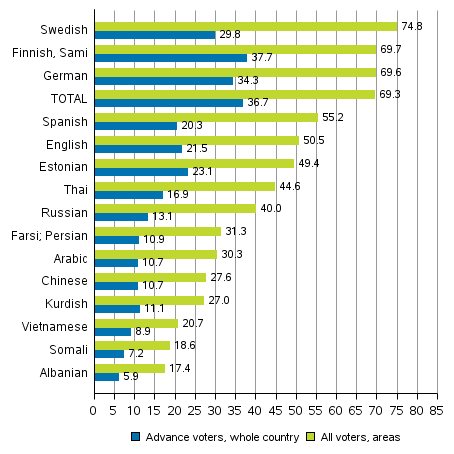
A more detailed examination of the voting turnout of different language groups shows that the highest voting percentage among all votes cast in the areas was found among Swedish speakers (74.8%). Correspondingly, the voting percentage of Finnish and Sami speakers was 69.7 per cent. Figure 8 includes the largest language groups measured by absolute numbers in the areas for which data were also available for election day voting. With this limitation, the voting percentage of foreign-language speakers was highest for German speakers, 69.6 per cent of persons entitled to vote. For other foreign-language speaking groups, only Spanish and English speakers’ voting turnout exceeded 50 per cent. (Figure 8)
Figure 8. Share of those who voted among persons entitled to vote by language group in the Presidential election 2018, %
Examined by age group and origin, young people’s voting turnout was lower than in older age groups both among persons of Finnish background and of foreign background. This is visible both among advance voters in the whole country and all who voted in the areas. For all who voted in the areas, the difference between voting turnout among persons of Finnish and foreign background was around 31 percentage points. The voting turnout of persons with foreign background remains under 30 per cent in the 18 to 34 age groups, voting by over one-half of persons with foreign background was not reached until in the age group of 55 or over. (Table 6)
Table 6. Share of advance voters in the whole country and all who voted in the areas among persons entitled to vote by origin and age in the Presidential election 2018, %
| Age group | Total population |
Persons with Finnish background |
Persons with foreign background |
|||
| Advance voters, whole country |
All who voted, in areas |
Advance voters, whole country |
All who voted, in areas |
Advance voters, whole country |
All who voted, in areas |
|
| Total | 36.7 | 69.3 | 37.2 | 69.9 | 15.3 | 38.4 |
| 18-24 | 22.4 | 49.2 | 22.9 | 49.9 | 8.0 | 20.8 |
| 25-34 | 24.2 | 57.4 | 24.7 | 58.3 | 10.2 | 27.0 |
| 35-44 | 25.6 | 70.0 | 26.1 | 71.0 | 11.4 | 37.5 |
| 45-54 | 31.8 | 74.3 | 32.3 | 75.0 | 14.4 | 43.9 |
| 55-64 | 43.4 | 77.7 | 43.8 | 78.1 | 21.3 | 50.6 |
| 65-74 | 56.5 | 81.7 | 56.8 | 81.9 | 33.7 | 62.0 |
| 75- | 49.3 | 66.8 | 49.4 | 66.9 | 39.2 | 57.7 |
Source: Presidential Elections 2018, Review of voting, Statistics Finland
Inquiries: Sami Fredriksson 029 551 2696, Jaana Asikainen 029 551 3506, vaalit@stat.fi
Director in charge: Jari Tarkoma
Updated 3.4.2018
Official Statistics of Finland (OSF):
Presidential elections [e-publication].
ISSN=2242-3699. 2018,
1. Persons who voted in the Presidential elections 2018
. Helsinki: Statistics Finland [referred: 19.4.2024].
Access method: http://www.stat.fi/til/pvaa/2018/pvaa_2018_2018-04-03_kat_001_en.html