

Published: 10 September 2010
Growth of industrial output continued in July
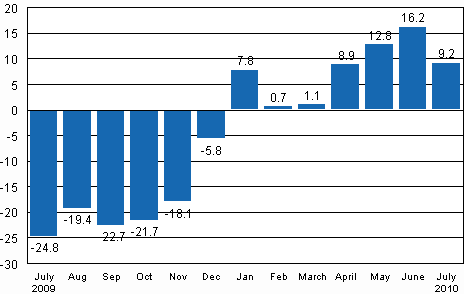
According to Statistics Finland, output of total industries adjusted for working days was 9.2 per cent higher in July 2010 than twelve months earlier. In June output was 16.2 per cent higher than one year earlier. In January to July 2010 industrial output has grown by 8.2 per cent from one year back.
Working day adjusted change in industrial output (BCDE) from corresponding month previous year, %, TOL 2008
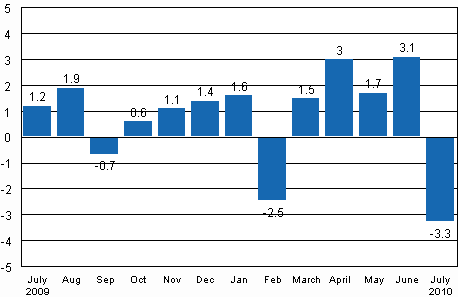
Seasonally adjusted output declined in July by 3.3 per cent compared with the previous month. In June seasonally adjusted output increased by 3.1 per cent from the month before. In May seasonally adjusted output grew by 1.7 per cent from April.
Seasonally adjusted change in industrial output (BCDE) from previous month, %, TOL 2008
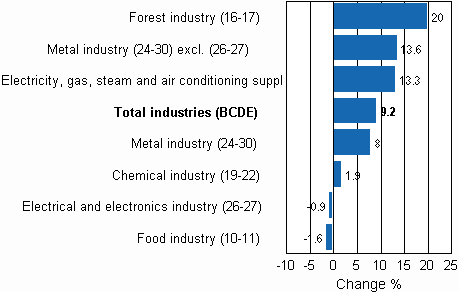
The majority of the main industries grew in July. Output rose most in the forest industry, by 20 per cent. Output in the metal industry (excl. electrical and electronics industry) grew by 13.6 per cent. Output in electricity continued to grow strongly. Its output grew by 13.3 per cent in July from one year ago. Output in the chemical industry increased by just under two per cent in July. Output in the chemical industry in June was good 13 per cent up year-on-year. In the electrical and electronics industry, output fell by just under one per cent. In the food industry the decline in output amounted to 1.6 per cent in July.
Working day adjusted change in industrial output by industry 7/2009-7/2010, %, TOL 2008
In July, capacity utilisation rate in manufacturing was almost 70 per cent, or 9.7 percentage points higher than twelve months earlier. In the forest industry capacity utilisation rate was in July 75 per cent, and had risen by nearly 17 percentage points from one year back. In the metal industry capacity utilisation was 67.7 per cent in July, or nine percentage points higher than one year earlier.
Estimation
Statistics Finland has increased the use of estimation and around ten per cent of the index for July was estimated. In the electrical and electronics industry (26-27) estimation was used in the calculation of the July index. The Tax Administration’s value added data are used to compile statistics on the output of enterprises with fewer than 50 employees. Enterprises with fewer than 50 employees account for around 13 per cent of industrial output and these data cover nearly 70 per cent of the production of enterprises with fewer than 50 employees. These data are not at Statistics Finland's disposal by the release date of the volume index of industrial output. For this reason the data on these enterprises are estimated for the month the release relates to, i.e. in this case July. The Tax Administration's data will be available when releasing data for the month for the second time, i.e. in the data for June.
Revised data for July will be published at 9 am on 8 August 2010 in connection with the release of industrial output data for August. Because of the method used, seasonally adjusted figures for previous months may change even if the original figures do not become revised. The seasonally adjusted figures are also adjusted for working days. Statistics Finland will release the so-called final annual volume indices for the year 2009 in connection with the index for August on 8 October 2010. The preliminary monthly volume index is calculated using data obtained from a sample of approximately 1,000 establishments or enterprises. The calculation of the final annual volume index is based on the regional and industrial statistics on manufacturing calculated from structural statistics on manufacturing. In this same connection the establishment and industry-specific weights are changed to correspond to the situation in 2009. The changes have an effect on the data for 2009 and the early part of 2010.
Source: Volume Index of Industrial Output 2010, July. Statistics Finland
Inquiries: Kari Rautio (09) 1734 2479, Jukka Appelqvist (09) 1734 3391, volyymi.indeksi@stat.fi
Director in charge: Hannele Orjala
Publication in pdf-format (271.7 kB)
- Reviews
-
- Industrial output grew by 9.2 per cent in July (10.9.2010)
- Tables
-
Tables in databases
Pick the data you need into tables, view the data as graphs, or download the data for your use.
- Figures
-
- Appendix figure 1. Working day adjusted change percentage of industrial output July 2009 /July 2010, TOL 2008 (10.9.2010)
- Appendix figure 2. Seasonally adjusted change percentage of industrial output June 2010 /July 2010, TOL 2008 (10.9.2010)
- Appendix figure 3. Trend of industrial output Finland, Germany, Sweden, France and United Kingdom (BCD) 2000 - 2010, 2005=100, TOL 2008 (10.9.2010)
Updated 10.9.2010
Official Statistics of Finland (OSF):
Volume index of industrial output [e-publication].
ISSN=1798-9272. July 2010. Helsinki: Statistics Finland [referred: 16.4.2024].
Access method: http://www.stat.fi/til/ttvi/2010/07/ttvi_2010_07_2010-09-10_tie_001_en.html