

Published: 6 November 2014
Young women highly educated, Uusimaa has the population with highest educational qualifications
By the end of 2013, a total of 3,164,095 persons in Finland had attained post-comprehensive level educational qualifications in upper secondary general school education, vocational education, polytechnic education or university education. In other words, 69 per cent of the population aged 15 or over had completed a post-comprehensive level qualification. The share of those with a post-comprehensive level qualification remained unchanged.
Population by level of education, age and gender 2013
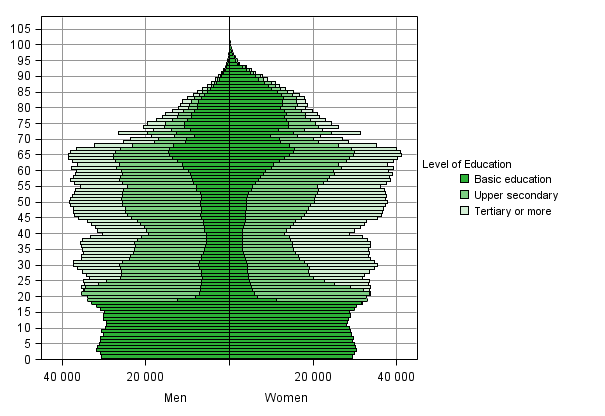
The educational differences between age groups can be examined by comparing the changes in the population shares of those with tertiary level degrees. Younger generations (aged 25 to 34) are more highly educated than older generations (aged 55 to 64). Especially young women are more highly educated, while young men are less educated than the older age groups. The population share of young women with higher level tertiary qualifications is 10,1 percentage points higher than for the older comparison group. Correspondingly, the share of young men is 1.6 percentage points lower. In other words, the rise in women's level of education has been rapid. Young people are more highly educated in almost all regions, the only exceptions are Kanta-H�me and �land, where the older generations have better education, and Kymenlaakso, where there are no differences in the level of education between the age groups. Young women are more highly educated than older women in all regions of Finnish mainland, while young men are, as a rule, less educated than older men. The educational level of young men exceeds the educational level of older men in the regions of Pirkanmaa, Central Finland, North Ostrobothnia, Ostrobothnia, North Karelia and Kainuu.
Difference between age groups with tertiary education by gender 2013
| Region | Both Genders | Men | Women |
| Difference between the 25-34 and 55-64 year-old population, pecentage point | Difference between the 25-34 and 55-64 year-old population, pecentage point | Difference between the 25-34 and 55-64 year-old population, pecentage point | |
| Whole Country | 4,0 | -1,6 | 10,1 |
| Mainland Finland | 4,0 | -1,5 | 10,1 |
| Uusimaa | 0,8 | -5,9 | 7,7 |
| Varsinais-Suomi | 3,2 | -3,3 | 9,8 |
| Satakunta | 2,2 | -3,4 | 8,9 |
| Kanta-H�me | -2,5 | -8,1 | 3,5 |
| Pirkanmaa | 5,0 | 0,3 | 10,2 |
| P�ij�t-H�me | 1,3 | -4,4 | 7,5 |
| Kymenlaakso | 0,0 | -5,9 | 6,9 |
| South Karelia | 5,5 | -0,2 | 12,1 |
| Etel�-Savo | 3,2 | -2,5 | 10,0 |
| Pohjois-Savo | 4,3 | -0,6 | 10,0 |
| North Karelia | 7,9 | 2,7 | 14,0 |
| Central Finland | 5,8 | 1,3 | 10,9 |
| South Ostrobothnia | 5,2 | -0,8 | 12,1 |
| Ostrobothnia | 5,9 | 0,7 | 12,6 |
| Central Ostrobothnia | 6,0 | -1,5 | 14,3 |
| North Ostrobothnia | 4,9 | 0,6 | 9,9 |
| Kainuu | 5,5 | 1,6 | 10,4 |
| Lapland | 1,8 | -3,3 | 7,6 |
| �land | -6,6 | -12,7 | 0,0 |
| �land | -6,6 | -12,7 | 0,0 |
Second generation immigrants with foreign background, i.e. those born in Finland, are mainly young people. Sixty-six per cent of second generation immigrants with foreign background belong to the age group 15 to 24, whose studying career is only beginning. The highest educated second generation immigrants with foreign background are persons aged 45 to 54, among whom 84.4 per cent have completed post-comprehensive level qualifications and 35.4 per cent tertiary level education. Measured by population share, persons aged 45 to 54 are nearly as highly educated as persons with Finnish background born in Finland, of whom 87 per cent have completed post-comprehensive level qualifications and 40.8 per cent tertiary level education.
Educational attainmet of second level immigrants with foreign background by age 2013
| Age | Total | Basic education or less (ISCED 2 or less) | Population with educational qualifications | Upper secondary /Post-secondary non tertiary education (ISCED 3/4) | ISCED 5 or more | |||||
| % | % | % | % | % | ||||||
| Total | 10 080 | 100,0 | 6 351 | 63,0 | 3 729 | 37,0 | 2 620 | 26,0 | 1 109 | 11,0 |
| 15-24 | 6 645 | 100,0 | 5 189 | 78,1 | 1 456 | 21,9 | 1 408 | 21,2 | 48 | 0,7 |
| 25-34 | 360 | 100,0 | 97 | 26,9 | 263 | 73,1 | 150 | 41,7 | 113 | 31,4 |
| 35-44 | 232 | 100,0 | 57 | 24,6 | 175 | 75,4 | 93 | 40,1 | 82 | 35,3 |
| 45-54 | 263 | 100,0 | 41 | 15,6 | 222 | 84,4 | 129 | 49,0 | 93 | 35,4 |
| 55-64 | 942 | 100,0 | 256 | 27,2 | 686 | 72,8 | 370 | 39,3 | 316 | 33,5 |
| 65-74 | 1 139 | 100,0 | 441 | 38,7 | 698 | 61,3 | 356 | 31,3 | 342 | 30,0 |
| 75- | 499 | 100,0 | 270 | 54,1 | 229 | 45,9 | 114 | 22,8 | 115 | 23,0 |
In 2013, there were 117,858 persons aged 20 to 29 with only basic level of education, which is 17.3 per cent of the age group. Among men, 19.7 per cent of the age group had only basic level education and 14.9 per cent among women. The share of those with only basic level education has decreased by 2.0 percentage points over the past 25 years. The share of those with only basic level education was lowest at the beginning of the 2000s when the share was 16.4 per cent. The share of those with only basic level education has, however, made an upturn.
Source: Education 2014. Statistics Finland
Inquiries: Mika Witting 029 551 3571 , koulutustilastot@stat.fi
Director in charge: Riitta Harala
Publication in pdf-format (263.6 kB)
- Tables
-
Tables in databases
Pick the data you need into tables, view the data as graphs, or download the data for your use.
Appendix tables
- Figures
Updated 6.11.2014
Official Statistics of Finland (OSF):
Educational structure of population [e-publication].
ISSN=2242-2919. 2013. Helsinki: Statistics Finland [referred: 19.4.2024].
Access method: http://www.stat.fi/til/vkour/2013/vkour_2013_2014-11-06_tie_001_en.html