

1. Gross domestic product grew by 0.5 per cent in 2015
The volume of GDP grew by 0.5 per cent last year. The growth rate became slightly revised from the figure published at the end of February, which was 0.4 per cent.
Figure 1. Annual change in the volume of gross domestic product, per cent
In 2015, Finland's national economy grew after three years of downturn. The growth was biggest in the second quarter, when GDP grew by 0.5 per cent from the previous quarter, in the other quarters, growth was close to zero. Employment declined during the year.
Figure 2. Volume change of GDP from the previous quarter, seasonally adjusted, per cent
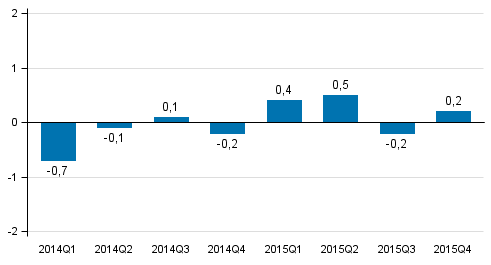
In the first half of 2015, GDP grew as a result of improved exports and consumption. In the third quarter, a decline in exports and investments turned the growth in GDP negative, but in the last quarter, GDP again made an upturn as investments grew clearly, and exports as well as private consumption expenditure increased somewhat.
According to preliminary data compiled by Eurostat, GDP in the EU-28 area grew by 0.4 per cent in the fourth quarter of 2015 compared to the previous quarter. In the whole year 2015, GDP in the EU area increased by 1.9 per cent.
1.1 Output by industry
In the last quarter, the combined volume of value added in the national economy decreased by 0.1 per cent from the previous quarter. In the whole of 2015, value added was 0.6 per cent higher than in 2014.
Measured in euros, value added increased mainly in private services. Among the manufacturing industries, value added calculated at current prices was bigger than in 2014 only in the forest industry and the metal industry (excl. the electrical and electronics industry).
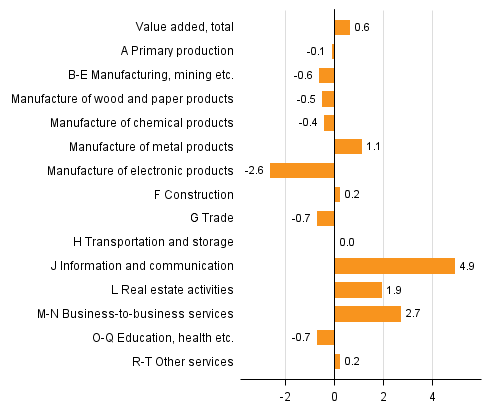
Figure 3. Annual change in value added generated by industries in 2015, per cent
The volume of value added in primary production, that is, agriculture, forestry and fishery, went down by 0.1 per cent in October to December from the previous quarter.
In the whole year, primary production decreased by 0.1 per cent. Production in agriculture grew by 2.0 per cent measured by volume but fell by 1.0 per cent in forestry. Examined at current prices, value added in agriculture also decreased considerably as a result of lower prices.
In the last quarter, the volume of total manufacturing (industries B to E) went up by 0.1 per cent from the previous quarter.
Total manufacturing contracted by 0.6 per cent in the whole of 2015. Value added fell most in the manufacture of electrical and electronics industry, by 2.6 per cent. By contrast, output in other metal industry grew by 1.1 per cent. In other manufacturing industries, the volume of output decreased.
From October to December, the volume of value added in construction increased by 0.5 per cent from the previous quarter.
The volume of construction went up slightly, by 0.2 per cent, in the whole of 2015. Building construction declined slightly but civil engineering increased clearly.
From October to December, the volume of value added in service industries decreased by 0.2 per cent.
Over the whole year 2015, service industries as a whole grew by 0.9 per cent. Private services grew by 1.8 per cent but public services decreased by 1.1 per cent. Growth was biggest in information and communication activities, 4.9 per cent and in financial and insurance activities, 3.8 per cent. Value added decreased most in public administration and education and in human health and social work activities, by 0.7 per cent. The value added of trade also declined despite the pickup in motor vehicle trade.
1.2 Imports, exports, consumption and gross fixed capital formation
In 2015, total demand in the national economy decreased further, by 0.4 per cent from the previous year. Demand decreased as investments contracted by 1.1 per cent and inventories in manufacturing shrunk considerably after the growth seen in 2014.
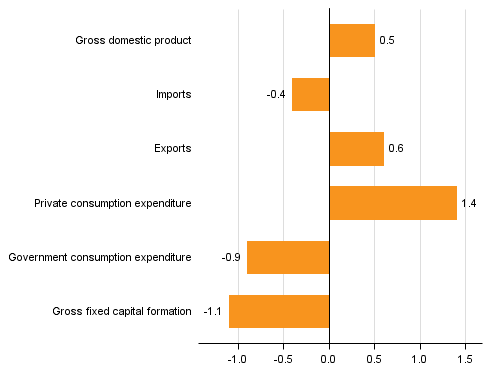
Figure 4. Annual changes in the volume of main supply and demand items in 2015, per cent
The volume of exports grew by 0.6 per cent and that of imports by 2.2 per cent in October to December from the previous quarter.
The volume of exports increased by 0.6 per cent over 2015. Exports of goods diminished but exports of services increased clearly. The volume of imports, in turn, went down by 0.4 per cent. Goods imports diminished but imports of services increased.
In the last quarter, the volume of private consumption went up by 0.2 per cent from the previous quarter. The volume of public consumption expenditure grew by 0.6 per cent.
Over the year 2015, the volume of private consumption expenditure grew by 1.4 per cent. Especially consumption of durable goods increased, as did consumption of services. The volume of public consumption expenditure contracted by 0.9 per cent.
In the last quarter, the volume of investments grew by 1.7 per cent from the previous quarter. Investments in civil engineering and other structures grew by 5.6 per cent and machinery, equipment and transport equipment investments by 10.8 per cent year-on-year.
In the whole year 2015, investments decreased for the fourth year in succession, by 1.1 per cent. Especially building construction investments declined by 2.9 per cent and investments in intellectual property products like research and development fell by 4.8 per cent. By contrast, investments in civil engineering grew by 6.6 per cent and machinery and equipment investments by 3.3 per cent.
1.3 Employment weakened
The number of employed persons fell by 0.3 per cent and that of hours worked by 0.1 per cent last year. According to Statistics Finland’s Labour Force Survey, the rate of unemployment grew to 9.4 per cent, while in 2014 it was 8.7 per cent.
Labour productivity, or the volume of gross value added per hour worked, grew by 0.7 per cent last year.
1.4. Price level almost unchanged
The economy’s overall price level is estimated to have risen by 0.4 per cent last year as measured by the GDP price index.
Last year, the Consumer Price Index declined by 0.2 per cent, but the price index of household consumption expenditure in National Accounts went up by 0.2 per cent. In National Accounts, the prices of housing services are measured with changes in market rents, whereas the Consumer Price Index also takes into consideration the expenditure on owner-occupied housing. The methods used in National Accounts and in the Consumer Price Index for measuring development in the prices of insurance and financial intermediation services also deviate from each other.
The terms of trade improved because export prices decreased by 1.0 per cent but import prices by 3.2 per cent.
1.5 National income increased in real terms
Net national income grew by 0.9 per cent in nominal terms but by 1.6 per cent in real terms last year because the terms of trade improved. National income per capita was EUR 31,000. Finland's gross national income amounted to EUR 209 billion last year. Gross national income grew by 1.4 per cent in real terms.
Households’ wage and salary income went up by 0.8 per cent and employers’ social insurance contributions by 1.9 per cent. In all, the share of compensation of employees in national income was 60.4 per cent, or the same as last year. Property income and entrepreneurial income in the national economy increased by 0.8 per cent and their share of the national income contracted slightly to 23.6 per cent.
1.6. Enterprises' financial position improved
Non-financial corporations' operating surplus describing profits from their actual operations went down by one per cent from the previous year. By contrast, non-financial corporations’ entrepreneurial income increased by four per cent because property income received by non-financial corporations grew by ten per cent from the year before. Entrepreneurial income also takes into consideration property income and paid interests and rents, and corresponds roughly with profit before payment of taxes and dividends.
Figure 5. Non-financial corporations, operating profit from the operations proper before payment of taxes and dividends, etc. and after EUR billion
Non-financial corporations paid 14 per cent more direct taxes last year than in the previous year. Non-financial corporations are estimated to have paid eight per cent less dividends. Non-financial corporations’ net lending, or financial position, showed a surplus of EUR 9.2 billion, as against EUR 7.1 billion in the previous year. Net lending improved thanks to a reduction in inventories.
The financial position of financial and insurance corporations showed a surplus of EUR 0.5 billion while it was EUR 0.1 billion in the previous year. Financial corporations’ commission income grew by four per cent but interest income (financial intermediation services indirectly measured) remained almost unchanged. Because income grew by more than compensation of employees and the bank tax was removed, the operating surplus of financial corporations grew by 14 per cent.
1.7 General government deficit 2.7 per cent of GDP
General government’s net lending, or financial position, showed a deficit of EUR 5.7 billion, while the deficit was EUR 6.5 billion in the previous year. The deficit amounted to 2.7 per cent relative to GDP. In the previous year the deficit amounted to 3.2 per cent of GDP.
Last year, the financial position of central government showed a notable deficit for the seventh successive year. The deficit (net borrowing) was EUR 6.3 billion, while one year before it was EUR 7.7 billion.
State revenues from taxes went up by 1.7 per cent. Revenues from corporation taxes, energy taxes, inheritance and gift tax, and tobacco tax increased most. Tax revenues decreased as a result of the abolition of the bank tax.
Current transfers to local government (incl. repayments of value added tax) declined by 1.1 per cent. Current transfers to social security funds, in turn, grew by 1.2 per cent. Central government's consumption expenditure fell by 1.5 per cent and investments by 1.3 per cent.
The deficit or net borrowing of local government (municipalities and joint municipal authorities, etc.) was EUR 1.4 billion, having been EUR 1.6 billion in the year before. Municipalities' tax revenues increased by 3.3 per cent as corporation tax, real estate tax and municipal tax grew. Consumption expenditure went up by 0.8 per cent in nominal terms mainly due to purchasing of services but gross fixed capital formation is estimated to have declined by 0.5 per cent.
The surplus of employment pension schemes decreased from the previous year. The surplus was now EUR 2.9 billion, while one year before it was EUR 3.4 billion. For example, the State Pension Fund’s higher than usual income recognition to the state lowered the lowered the surplus. The surplus does not include holding gains in assets. Revenues from pension contributions grew by 2.7 per cent and employment pensions paid by employment pension funds went up by 3.8 per cent mainly as a result of an increase in the number of pensioners. Other social security funds were EUR 0.8 billion in deficit mainly due to increased unemployment expenses.
Figure 6. General government surplus/deficit, per cent of GDP
The so-called EDP debt, or consolidated gross debt, of general government grew to EUR 131 billion. Relative to GDP, it increased to 63,1 per cent, i.e. by 3,8 percentage points. Statistics Finland will publish the deficit and debt data that must be reported to the European Commission on 31 March 2016. The deficit and debt data published here may become revised in that connection.
General government's share of the gross value added was 20.7 per cent, having been 20.8 per cent one year earlier. The proportion of total public expenditure to GDP grew to 58.3 per cent. In the previous year, the proportion was 58.1 per cent. Total public expenditure includes a notable amount of internal public sector expenses that are included in the calculations twice.
The tax ratio, or the proportion of taxes and statutory social security contributions of GDP, was 44.5 per cent last year. The tax ratio increased by 0.6 percentage points from the previous year.
1.8 Households’ real income grew by one per cent
In 2015, households’ disposable income increased by 1.2 per cent in nominal terms and by 1.0 per cent in real terms. Households’ adjusted disposable income increased by 1.0 per cent in nominal terms and by 0.6 per cent in real terms. Adjusted income also takes into consideration welfare services, i.e. the individual services that general government and organisations produce for households, such as educational, health and social services.
Figure 7. Annual change in households’ disposable real income and household's adjusted real income, per cent
Wages and salaries received by households went up by 0.8 per cent and social benefits by 3.2 per cent. The wages and salaries sum went up due to the risen level of earnings as employment weakened at the same time. Social benefits increased because the number of pensioners and unemployed grew. Households’ property and entrepreneurial income decreased by 0.1 per cent.
Direct taxes paid by households and compulsory social security contributions increased by 2.1 per cent. Final consumption expenditure grew by 1.8 per cent in nominal terms. The savings rate, i.e. the ratio of savings to disposable income, turned marginally negative in 2015, to -0.1 per cent.
Households’ fixed investments primarily in dwellings declined by 0.8 per cent in nominal terms. The financial position of households showed a deficit of EUR 3.8 billion, while the deficit in the previous year was EUR 3.4 billion.
Households' indebtedness ratio grew further and stood at 124.9 per cent at the end of 2015, which was 3.3 percentage points higher than one year earlier. The indebtedness rate expresses the ratio between the loans and annual disposable net income in accordance with financial accounts. Annual financial accounts data on the situation at the end of the year are preliminary assessments.
1.9 Current account slightly in surplus
Last year, Finland's current account was EUR 0.3 billion in surplus after four years of being in deficit. When imports are also valued at FOB price (at the border of the exporting country) and not at CIF price (at the border of the importing country), as is done in the foreign trade statistics of Finnish Customs, the goods trade showed a surplus of EUR 2.5 billion. However, the balance of services trade showed a deficit of EUR 1.9 billion.
EUR 1.3 billion more property income was received from the rest of the world than was paid to it. The current transfer outflow was clearly higher than the received income transfers.
The data on property items and international trade in services are very preliminary.
1.10 Next revisions in June and July 2016
National accounts data concerning the first quarter of 2016 will be released on 3 June 2016. National Accounts for 2015 with more detailed data contents will be released on 14 July 2016.
These preliminary data are based on the information on economic development available by 9 March 2016. Methodological descriptions of National Accounts can be found on Statistics Finland’s website at: http://tilastokeskus.fi/til/vtp/men.html and http://tilastokeskus.fi/til/ntp/men_en.html
Source: National Accounts 2015, preliminary data. Statistics Finland
Inquiries: Olli Savela 029 551 3316, Tuomas Rothovius 029 551 3360, kansantalous@stat.fi
Director in charge: Ville Vertanen
Updated 16.3.2016
Official Statistics of Finland (OSF):
Annual national accounts [e-publication].
ISSN=1798-0623. 2015,
1. Gross domestic product grew by 0.5 per cent in 2015
. Helsinki: Statistics Finland [referred: 18.4.2024].
Access method: http://www.stat.fi/til/vtp/2015/vtp_2015_2016-03-16_kat_001_en.html