 |
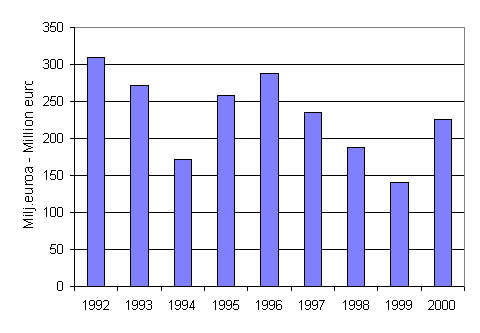
Environmental protection investment by Finnish industry, 1992-2000
- Statistical methods have changed. Therefore the figures by industrial sector for 1998 and 1999 cannot be compared with earlier data.
- FIM-denominated values have been converted to euro at the fixed conversion rate of EUR 1 = FIM 5,94573.
- Waste management includes soil and groundwater protection.
Environmental protection investment by industrial sector, 1992-2000 (1000 euro)
| |
1992 |
1993 |
1994 |
1995 |
1996 |
1997 |
|
1998 |
1999 |
2000 |
| Energy and water supply |
111 948 |
122 375 |
37 459 |
12 677 |
32 990 |
61 913 |
: |
4 666 |
6 901 |
16 455 |
| Forest industry |
113 223 |
97 372 |
82 490 |
154 518 |
140 658 |
71 182 |
: |
92 871 |
64 756 |
108 334 |
| Chemical and mineral industry |
27 821 |
36 523 |
18 989 |
38 970 |
39 696 |
45 967 |
: |
20 434 |
35 528 |
49 717 |
| Metal industry |
49 426 |
9 945 |
25 899 |
42 303 |
65 624 |
41 093 |
: |
47 877 |
23 756 |
28 545 |
| Other industry |
7 194 |
5 262 |
7 014 |
10 029 |
9 343 |
14 775 |
: |
21 665 |
9 355 |
22 026 |
| Total |
309 612 |
271 477 |
171 852 |
258 499 |
288 312 |
234 931 |
|
187 514 |
140 295 |
225 078 |
Environmental protection investment in industry, 1992-2000

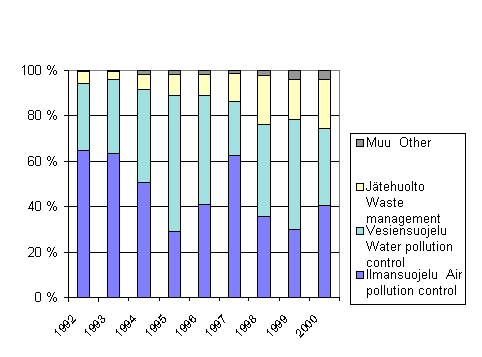
Environmental protection investment by environmental domain, 1992-2000 (1000 euro)
| Year |
Air |
Water |
Waste |
Other |
Total |
| 1992 |
199 837 |
92 328 |
15 931 |
1 515 |
309 611 |
| 1993 |
171 948 |
88 625 |
9 508 |
1 396 |
271 477 |
| 1994 |
86 803 |
71 035 |
10 912 |
3 102 |
171 852 |
| 1995 |
75 519 |
154 971 |
23 904 |
4 105 |
258 499 |
| 1996 |
117 786 |
138 591 |
26 548 |
5 389 |
288 313 |
| 1997 |
146 905 |
55 816 |
29 431 |
2 780 |
234 931 |
| 1998 |
66 999 |
75 739 |
40 943 |
3 832 |
187 514 |
| 1999 |
42 007 |
68 198 |
24 588 |
5 502 |
140 295 |
| 2000 |
91 117 |
76 748 |
48 580 |
8 632 |
225 078 |
Environmental protection investment by domain, 1992-2000

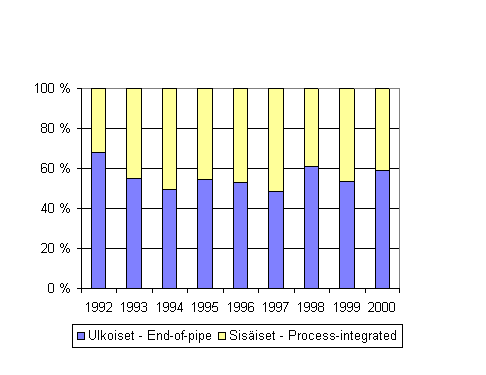
End-of-pipe and process-integrated environmental protection investments, 1992-2000 (1000 euro)
| 2000 |
End-of-pipe |
Process-integrated |
Yhteensä |
| Energy and water supply |
5 460 |
10 995 |
16 455 |
| Forest industry |
50 653 |
57 681 |
108 334 |
| Chemical and mineral industry |
40 353 |
9 365 |
49 717 |
| Metal industry |
18 570 |
9 975 |
28 545 |
| Other industry |
17 796 |
4 231 |
22 026 |
| Total in 2000 |
132 832 |
92 246 |
225 078 |
| Total in 1999 |
75 168 |
65 127 |
140 295 |
| Total in 1998 |
114 363 |
73 150 |
187 514 |
| Total in 1997 |
113 708 |
121 223 |
234 931 |
| Total in 1996 |
152 659 |
135 654 |
288 313 |
| Total in 1995 |
140 285 |
118 213 |
258 499 |
| Total in 1994 |
84 834 |
87 017 |
171 852 |
| Total in 1994 |
149 419 |
122 059 |
271 477 |
| Total in 1992 |
211 247 |
98 365 |
309 612 |
End-of-pipe and process-integrated environmental investments, 1992-2000

Home Page of Environment and Energy
Päivitetty 28.4.2004
Contact Information:
Eila Salomaa
E-mail: ymparisto.energia@stat.fi
|
 |


