 |
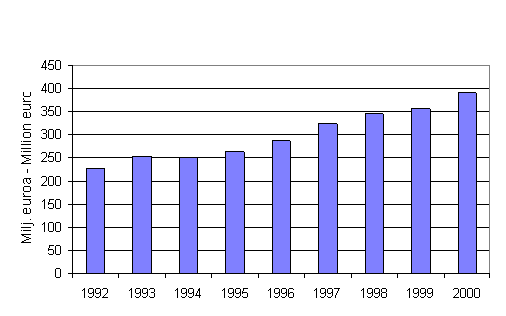
Environmental Operating Expenditure in Finnish Industry, 1992-2000
- Statistical methods have changed. Therefore the figures by industrial sector for 1998 and 1999 cannot be compared with earlier data.
- FIM-denominated values have been converted to euro at the fixed conversion rate of EUR 1 = FIM 5,94573.
- Waste management includes soil and groundwater protection.
Environmental operating expenditure by industrial sector, 1992-2000 (1000 euro)
| |
1992 |
1993 |
1994 |
1995 |
1996 |
1997 |
|
1998 |
1999 |
2000 |
| Energy and water supply |
25 747 |
35 471 |
32 847 |
33 678 |
35 287 |
39 167 |
: |
34 893 |
36 990 |
35 265 |
| Forest industry |
53 274 |
60 653 |
74 295 |
75 986 |
79 915 |
96 603 |
: |
103 577 |
102 259 |
107 870 |
| Chemical and mineral industry |
55 777 |
71 357 |
53 004 |
62 325 |
72 930 |
82 473 |
: |
80 093 |
95 685 |
108 478 |
| Metal industry |
39 761 |
45 851 |
49 550 |
52 504 |
55 893 |
53 961 |
: |
75 118 |
78 241 |
82 305 |
| Other industry |
53 304 |
40 632 |
40 991 |
40 432 |
42 702 |
52 395 |
: |
52 311 |
44 521 |
57 357 |
| Total |
227 863 |
253 964 |
250 686 |
264 924 |
286 725 |
324 599 |
|
345 992 |
357 695 |
391 275 |
Environmental operating expenditure in industry, 1992-2000

Environmental running and maintenance expenditure by industry, 1992-2000 (1000 euro)
| |
1992 |
1993 |
1994 |
1995 |
1996 |
1997 |
|
1998 |
1999 |
2000 |
| Energy and water supply |
17 865 |
26 080 |
24 182 |
23 612 |
24 885 |
32 444 |
: |
21 633 |
20 955 |
21 166 |
| Forest industry |
44 264 |
49 609 |
61 811 |
67 212 |
73 443 |
87 083 |
: |
90 429 |
88 332 |
92 501 |
| Chemical and mineral industry |
47 593 |
63 183 |
45 913 |
54 596 |
67 476 |
76 333 |
: |
73 040 |
87 719 |
95 631 |
| Metal industry |
36 144 |
40 857 |
44 150 |
48 003 |
50 992 |
48 791 |
: |
67 661 |
70 853 |
75 354 |
| Other industry |
51 500 |
38 631 |
38 943 |
37 587 |
40 223 |
49 209 |
: |
46 682 |
39 924 |
51 734 |
| Total |
197 366 |
218 360 |
214 998 |
231 011 |
257 018 |
293 862 |
|
299 445 |
307 783 |
336 386 |
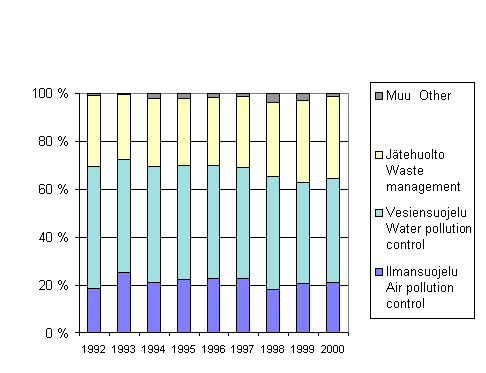
Environmental running and maintenance expenditure by environmental domain, 1992-2000 (1000 euro)
| Year |
Air |
Water |
Waste |
Other |
Total |
| 1992 |
36 856 |
100 281 |
58 251 |
1 979 |
197 366 |
| 1993 |
55 708 |
102 984 |
58 874 |
793 |
218 360 |
| 1994 |
45 328 |
103 833 |
61 321 |
4 516 |
214 998 |
| 1995 |
51 813 |
109 597 |
64 640 |
4 960 |
231 011 |
| 1996 |
59 100 |
120 554 |
73 305 |
4 059 |
257 018 |
| 1997 |
66 748 |
135 917 |
87 265 |
3 932 |
293 862 |
| 1998 |
55 264 |
140 036 |
93 399 |
10 747 |
299 445 |
| 1999 |
63 748 |
130 511 |
104 212 |
9 312 |
307 783 |
| 2000 |
71 935 |
145 475 |
114 219 |
4 756 |
336 386 |
Environmental running and maintenance expenditure by domain 1992-2000

Other environmental operating expenditure by industrial sector, 1992-2000 (1000 euro)
| |
1992 |
1993 |
1994 |
1995 |
1996 |
1997 |
|
1998 |
1999 |
2000 |
| Energy and water supply |
7 882 |
9 391 |
8 664 |
10 066 |
10 402 |
6 723 |
: |
13 260 |
16 035 |
14 099 |
| Forest industry |
9 010 |
11 045 |
12 484 |
8 774 |
6 472 |
9 520 |
: |
13 148 |
13 927 |
15 369 |
| Chemical and mineral industry |
8 183 |
8 174 |
7 091 |
7 729 |
5 454 |
6 140 |
: |
7 053 |
7 965 |
12 847 |
| Metal industry |
3 617 |
4 994 |
5 399 |
4 500 |
4 901 |
5 169 |
: |
7 457 |
7 388 |
6 951 |
| Other industry |
1 804 |
2 001 |
2 049 |
2 845 |
2 479 |
3 186 |
: |
5 629 |
4 597 |
5 623 |
| Total |
30 497 |
35 604 |
35 687 |
33 913 |
29 707 |
30 738 |
|
46 547 |
49 912 |
54 889 |
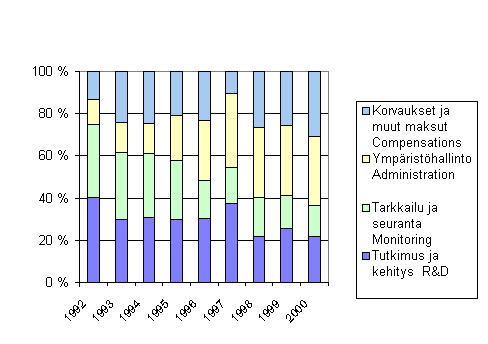
Other environmental operating expenditure by item, 1992-2000 (1000 euro)
| |
1992 |
1993 |
1994 |
1995 |
1996 |
1997 |
1998 |
1999 |
2000 |
| R&D |
12 239 |
10 565 |
10 923 |
10 065 |
8 955 |
11 516 |
10 075 |
12 672 |
11 844 |
| Monitoring and supervision |
10 571 |
11 376 |
10 891 |
9 510 |
5 379 |
5 261 |
8 697 |
8 013 |
8 073 |
| Environment-related administrative expenditure |
3 618 |
5 116 |
5 020 |
7 220 |
8 461 |
10 752 |
15 393 |
16 404 |
18 098 |
| Compensation and other payments |
4 069 |
8 548 |
8 854 |
7 117 |
6 913 |
3 209 |
12 382 |
12 822 |
16 874 |
| Total |
30 497 |
35 604 |
35 687 |
33 913 |
29 707 |
30 738 |
46 547 |
49 912 |
54 889 |
Other environmental operating expenditure by item, 1992-2000

Home Page of Environment and Energy
Päivitetty 28.4.2004
Contact Information:
Eila Salomaa
E-mail: ymparisto.energia@stat.fi
|
 |


