Parliamentary elections 2003 - background information on the candidates and elected MPs
Pekka Myrskylä
The total number of candidates in the Parliamentary elections is 2,029. Of these, 1,221 are men and 808 women. Twenty candidates are Finnish citizens domiciled abroad, which means that information on them cannot be collected from domestic registers. Because of that, the background information presented here differs from other candidate statistics published by Statistics Finland. (Candidates in the Åland constituency are excluded from the analysis due to sample smallness in order to preclude disclosure of personal information).
Of the major parties the Centre Party and the Swedish People's Party have the lowest proportion of female candidates (42%). In the Social Democratic Party and the National Coalition Party male candidates hold a slim majority of a few percentages. The Green League is the sole party where women outnumber men by a few percentages.
Proportion of men and women of elected MPs and candidates by party 2003
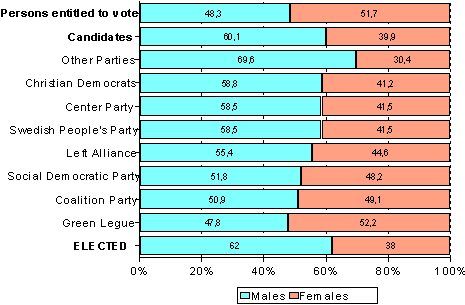
Thirty-eight per cent of the elected MPs were women, which is slightly less than the proportion of female candidates.
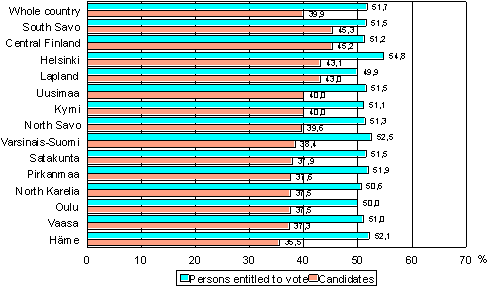
The proportion of female candidates is highest in Etelä-Savo (45.3%) and Central Finland (45.2%), and lowest in Häme (35.5%). In the constituencies of Vaasa, Oulu, North Karelia, Pirkanmaa and Satakunta, the proportion of female candidates is 37 to 38 per cent. The constituency of Helsinki has the largest female electorate majority of the country, 54.8 per cent. Only 43.1 per cent of the candidates are women.
In the constituency of Helsinki one half of the elected MPs are women and in Uusimaa almost one half: 16 men and 14 women. More women than men were elected only in the constituencies of Varsinais-Suomi and Häme.
Women's proportion of persons entitled to vote and candidates in 2003
The average age of the male candidates is 47.9 years, and that of the female candidates 43.6 years, the age difference being four years. The youngest female candidates (average age 39.3 years) are nominated in Central Finland, the youngest male candidates (41.4 years) in Satakunta. The average age of the male candidates is highest in North Karelia (51.0) and Lapland (49.3). North Karelia has the largest age difference (10.3 years) between female and male candidates.
Candidates by gender mean age in 2003
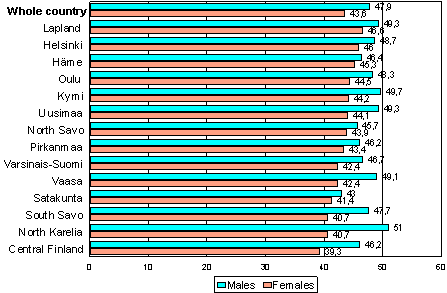
The oldest MPs were elected from the constituency of Satakunta, the average age being 54.8. Other constituencies varied from 49.7 years in Central Finland to 45.7 years in Vaasa.
Employment
One half of all persons entitled to vote are employed, eight per cent are unemployed, eight per cent are students, and 30 per cent pensioners. Of the candidates of the three major parties, the majority are employed (the Coalition Party and Social Democrats 88%, the Centre Party 84%), almost none are unemployed, and students or pensioners taken together make up only ten to fifteen per cent (the higher number pertaining to the Centre Party). The proportion of student candidates is highest among the Greens.
Elected MPs and candidates by main type of activity in 2003
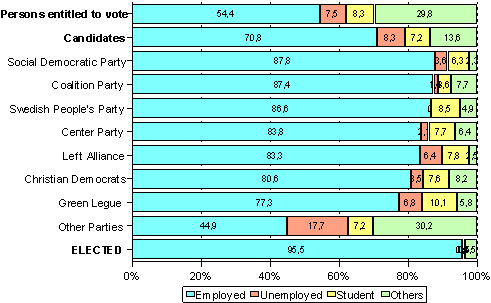
Candidate selection thus leads to a higher than average proportion of employed persons and a lower than average proportion of pensioners. The proportion of unemployed persons and students is the same for candidates as for the general electorate. Since the last elections the proportion of employed persons has risen by four percentage points in both groups.
Almost all the elected MPs (96%) are emplyed, some are not in working life, i.e retired.
Family type and number of children
More than one half (53%) of all persons entitled to vote are married, 13 per cent are cohabiting and one fourth do not belong to a family. 59 per cent of the candidates are married, 11 per cent are cohabiting and 22 per cent do not belong to a family. In both groups, 8 per cent are single parents. Christian Democrat candidates differ most from the average population: 84 per cent are married, and only 2 per cent are cohabiting.
Elected MPs and candidates by family type in 2003
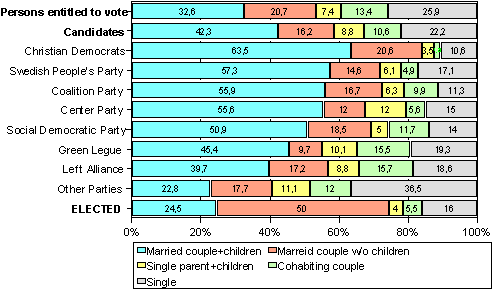
The majority of the major party candidates are also married: 67 per cent of Centre Party candidates, 73 per cent of Coalition Party candidates, and 69 per cent of Social Democrats (SDP). The Social Democratic Party has the greatest proportion of cohabiting candidates (12%). The proportion of families consisting of married spouses and children has declined, whereas the proportion of cohabitation households has increased, as has the proportion of unmarried singles.
Of the elected MPs 75 per cent are married, six per cent are cohabiting and 16 per cent are singles.
Elected MPs and candidates by number of biological children in 2003
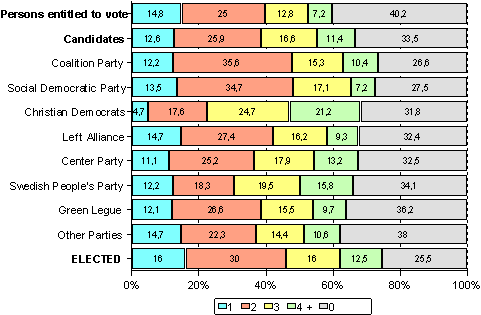
More than one half of the major party candidates live with their legal or cohabiting spouse as well as their children. Forty per cent of the persons entitled to vote - but only one third of the candidates - do not have children of their own. Candidates thus have a better grasp of the practicalities of family life with children than the average voter has. The proportion of candidates that do not have children of their own is greater in parties such as the Green League, which have a large proportion of young candidates.
Seventy-five per cent of the elected MPs have biological children, a quarter do not (at least yet) have children of their own. Of persons entitled to vote, 60 per cent have children. Large families are also more common to the elected MPs: 12.5 per cent have a family with four or more children.
Educational level
Persons entitled to vote and candidates and elected MPs by educational level in 2003
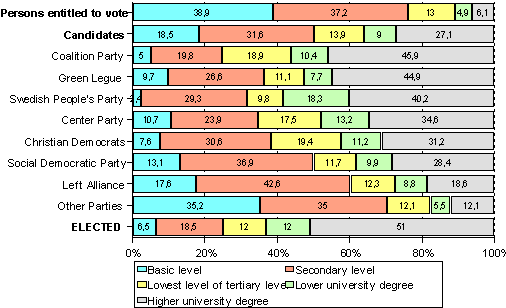
Highly educated people are seeking entry to the Parliament. The educational level of the candidates of almost all parties is higher than that of the average population. Of the total population, 39 per cent rely on basic level education, but this is the case for only 19 per cent of the candidates and for even fewer of the major party candidates, that is, 11 per cent for the Centre Party, 5 per cent for the Coalition Party, 2 per cent for the Swedish People's Party, 10 per cent for the Greens and 13 per cent for the Social Democratic Party. Almost one half of the major party candidates are educated to the tertiary level, but only 24 per cent of those entitled to vote have attained that level. The average level of education is lower among workers' party (Left Alliance and Social Democrat) candidates, one half of whom rely on basic or vocational education.
Persons with the highest education were elected: 63 per cent of the elected MPs had a university degree, while this is so for 36 per cent of the candidates and for just 11 per cent of persons entitled to vote.
Income
Income is the one variable that marks the greatest difference between candidates and voters. The 2001 taxable income of the candidates averaged EUR 34,200 - 74 per cent higher than the average income of the voters (EUR 19,700). The average income of Coalition Party and Centre Party candidates was three times higher than that of the persons entitled to vote.
Elected MPs and candidates by average income in 2003, 1999 and 1995 (EUR)
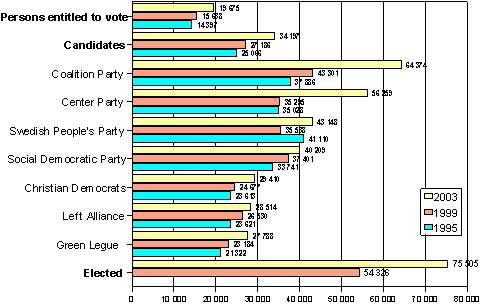
Voters' nominal income has increased by 26 per cent during the present parliamentary period, the same increase as for the average candidate. The rise in income was highest for Centre Party and Coalition Party candidates - 59 per cent for Centre Party candidates and 49 per cent for Coalition Party candidates. The rise in income was 21 per cent for Swedish People's Party candidates, 20 per cent for Green League candidates and 7 per cent for Social Democrat candidates, that is, less than the average for the population as a whole.
High income earners were elected to the Parliament. The average income of the elected MPs, EUR 75,500, was double compared to candidates and nearly four times higher than that of persons entitled to vote.
The majority of the major party candidates had an income of more than EUR 42,000; in other words, 65 per cent of the candidates of the Coalition Party, 56 per cent of the candidates of the Centre Party, 54 per cent of the candidates of the Social Democratic Party and 52 per cent of the candidates of the Swedish People's Party. Of all the persons entitled to vote, the income of only 12 per cent exceeded EUR 42,000.
During the present parliamentary period the number of persons with an income in excess of EUR 42,000 has increased, particularly among Coalition Party, Centre party and Swedish People's Party candidates.
Elected MPs and candidates by taxable incomes in 2003
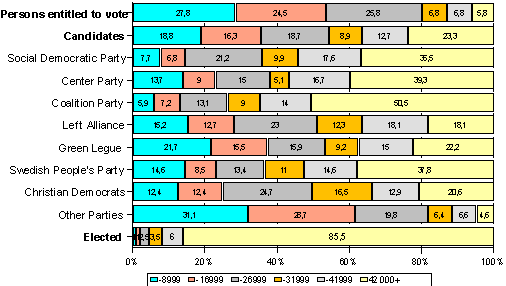
The proportion of low-income candidates is highest among the candidates of the Green League, the Left Alliance and the Christian Democrats. The income structure of the minor parties is the one that bears the closest resemblance to the average income structure of the general electorate.
Almost all of the elected MPs, 95 per cent, earn more than EUR 32,000, which income level is attained by only 19 per cent of the electorate and by 45 per cent of the candidates.
Average income of persons entitled to vote and candidates and elected MPs by constituency in 2003 (EUR)
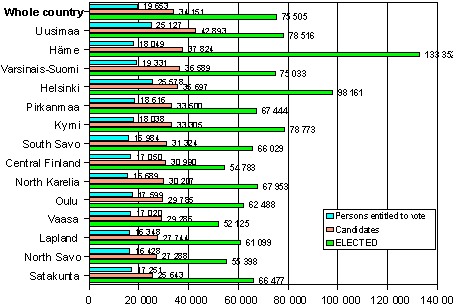
The candidates' income level reflects the regional variations in voters' income levels, albeit on a higher level. Candidates in the constituency of Uusimaa have the highest average income - EUR 42,900 - more than twice the average income of the Uusimaa voter. Candidates in Häme have the second highest average income (EUR 37,800) - also more than twice that of the constituency's voters. North Karelia has the poorest electorate, and Satakunta the poorest candidates. Even in North Karelia, candidates' average income is 93 per cent higher than the income of the voters.
In all constituencies, the income of candidates was about double compared to that of persons entitled to vote, while the income of elected MPs was still double compared to the candidates' income. The average income was highest in the constituency of Häme, EUR 133,400, and in Helsinki, EUR 98,200. Persons elected from the constituency of Vaasa had the lowest income, EUR 52,100.
Last updated 1.6.2005
Official Statistics of Finland (OSF):
Parliamentary elections [e-publication].
ISSN=1799-6279. 2003,
Parliamentary elections 2003 - background information on the candidates and elected MPs
. Helsinki: Statistics Finland [referred: 17.11.2025].
Access method: http://stat.fi/til/evaa/2003/evaa_2003_2004-05-31_kat_002_en.html

