

Output of Finland's national economy continued growing in January to March
In January to March, the seasonally adjusted volume of Finland’s gross domestic product increased by 0.6 per cent from the previous quarter. GDP adjusted for working days grew by 1.6 per cent compared to the first quarter of 2015. Calculated at current prices, gross domestic product adjusted for working days was 1.9 per cent higher than one year ago.
Figure 1. Volume change of GDP from the previous quarter, seasonally adjusted, per cent
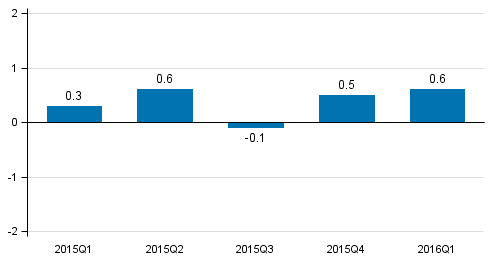
According to preliminary data compiled by Eurostat, GDP in the EU 28 area grew by 0.5 per cent in the first quarter of 2016 compared to the previous quarter.
Production
The volume of total value added generated by all industries increased by 0.7 per cent from the previous quarter and by 1.3 per cent from twelve months back.
Figure 2. Changes in the volume of value added in the 1st quarter of 2016 compared to one year ago (working day adjusted, per cent)
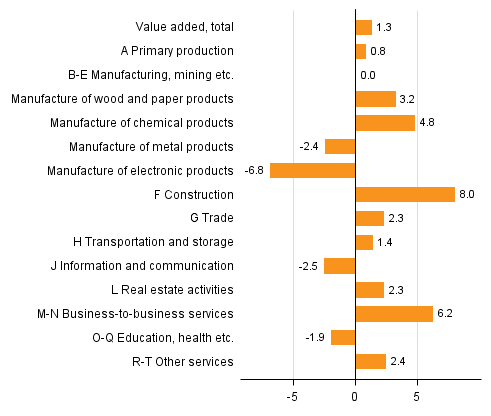
Figure 3. Changes in the volume of value added in the 1st quarter of 2016 compared to the previous quarter (seasonally adjusted, per cent)
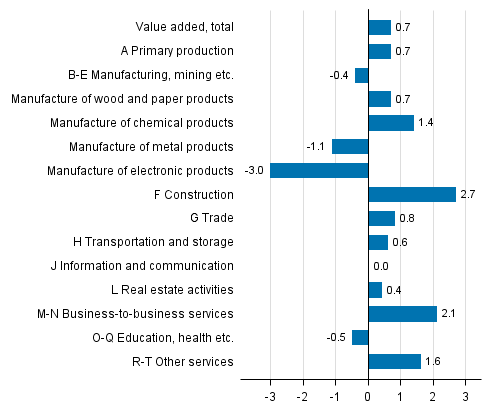
In primary production, that is, agriculture, forestry and fishing, the volume of value added grew in the first quarter by 0.7 per cent from the previous quarter and by 0.8 per cent from one year previously. The volume of value added in agriculture declined by 1.2 per cent year-on-year but forestry increased by 1.2 per cent from the level in the first quarter of 2015.
Value added in manufacturing industries decreased in January to March from the previous quarter by 0.4 per cent. Output of manufacturing industries decreased by 0.8 per cent from the previous quarter and was 1.3 per cent lower than one year ago. The volume of the electrical and electronics industry declined particularly much, being 6.8 per cent lower in the first quarter of 2016 than one year earlier. The metal industry (excl. electrical and electronics industry) decreased by 2.4 per cent year-on-year.
The construction industry grew by 2.7 per cent in January to March from the previous quarter and by as much as 8.0 per cent year-on-year. Civil engineering continued on a growth path that has now lasted for over a year, and in January to March building construction also grew clearly.
In service industries, value added remained on level with the previous quarter and increased by 0.1 per cent from twelve months back. Compared to one year ago, value added in private services grew by 2.6 per cent but value added in public services fell by 2.4 per cent.
The value added of trade was 0.8 per cent up on the previous quarter and 2.3 per cent up year-on-year. Motor vehicle trade has been especially lively already since the second half of 2015, and in January to March it grew by 1.5 per cent from the previous quarter and by 7.6 per cent from the corresponding quarter in 2015. Wholesale trade decreased by 0.7 per cent but retail trade increased by 1.3 per cent year-on-year.
Imports, exports, consumption and gross fixed capital formation
Total demand declined in January to March by 0.5 per cent from the previous quarter but remained on par with the level of the first quarter in 2015. Growth in private consumption expenditure and gross fixed capital formation in construction increased the demand in the national economy, while the decrease in exports contracted it.
Figure 4. Changes in the volume of main supply and demand items in the 1st quarter of 2016 compared to one year ago (working day adjusted, per cent)
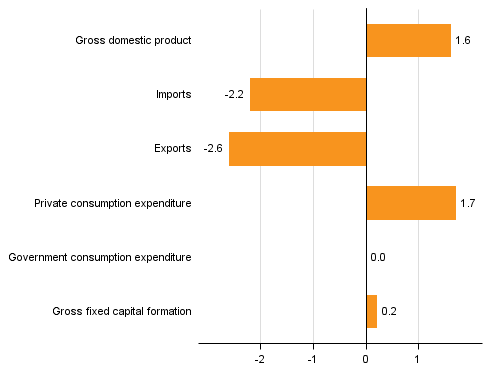
Figure 5. Changes in the volume of main supply and demand items in the 1st quarter of 2016 compared to the previous quarter (seasonally adjusted, per cent)
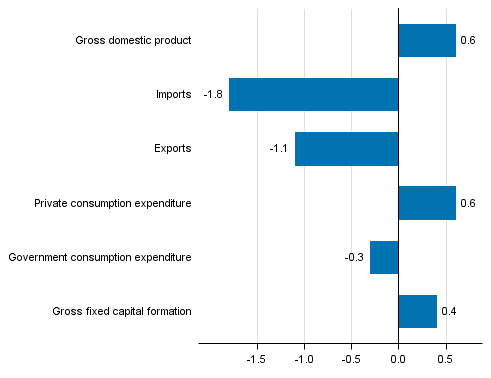
The volume of exports decreased by 1.1 per cent from the previous quarter. Compared with the volume one year ago, the volume of exports contracted by 2.6 per cent in January to March. Exports of goods decreased by 3.7 per cent from one year back. Exports of services increased by 0.2 per cent year-on-year.
The volume of imports decreased by 1.8 per cent from the previous quarter and by 2.2 per cent from a year ago. Imports of goods diminished by 2.4 per cent and those of services by 1.5 per cent year-on-year.
In the first quarter, the volume of private consumption grew by 0.6 per cent from the previous quarter and by 1.7 per cent from the corresponding quarter in 2015. Public consumption expenditure remained at the level of the first quarter of 2015.
Gross fixed capital formation, or investments, increased by 0.4 per cent from the third quarter. Private investments grew by 1.0 per cent but public investments decreased by 3.0 per cent from one year back.
Investments in residential buildings improved by 8.1 per cent and investments in non-residential buildings by 5.5 per cent from one year ago. Investments in civil engineering grew by 6.1 per cent year-on-year. The volume of gross fixed capital formation in machinery, equipment and transport equipment contracted by 12.1 per cent from the first quarter of 2015.
Employment, wages and salaries and national income
In the first quarter, the number of employed persons increased by 0.3 per cent from the previous quarter and by 0.4 per cent year-on-year. The number of hours worked in the national economy grew by 1.3 per cent from the previous quarter and by 2.1 per cent from one year back.
According to Statistics Finland’s Labour Force Survey, the unemployment rate for the January to March period was 9.6 per cent. In the corresponding period of last year it stood at 9.7 per cent.
In the January to March period, the nominal wages and salaries bill of the national economy grew by 0.4 per cent from the previous quarter and by 1.5 per cent year-on-year. Social contributions paid by employers grew by 2.6 per cent from last year.
The operating surplus (net), which in business bookkeeping corresponds roughly with operating profit, contracted by 0.2 per cent from twelve months back. Gross national income calculated at current prices was 1.9 per cent higher one year previously.
The available data
These preliminary quarterly data are based on the source information on economic development that had become available by 30 May 2016.
The annual level data for 1990 to 2014 correspond with the National Accounts data released on 29 January 2016, except for those on the rest of the world sector (imports, exports, primary income from/to the rest of the world), which may have become revised.
The National Accounts for 2014 and 2015 will be released on 14 July 2016. Then the time series of Quarterly National Accounts 1990N1 to 2016N1 will be benchmarked to the new time series of the National Accounts. The benchmarked data will be available in the database tables of the Quarterly National Accounts starting from the release date.
National Accounts data concerning the second quarter of 2016 will be released on 6 September 2016, when data for previous quarters will also be revised. A flash estimate on GDP development for April to June will be released in connection with the Trend Indicator of Output on 12 August 2016.
Due to the benchmarking and seasonal adjustment methods, quarterly data in the entire time series may become slightly revised in connection with each release. However, the largest revisions take place during the two to three years following the release on a quarter, because final annual accounts data are published at a lag of around two years from the end of the statistical reference year. Seasonally adjusted and trend time series always become revised against new observations irrespective of whether the original time series becomes revised or not.
The quality description can be accessed at (in Finnish): http://www.tilastokeskus.fi/til/ntp/laa.html .
Methodological description of Quarterly National Accounts.Source: National Accounts 2016, 1st quarter. Statistics Finland
Inquiries: Samu Hakala 029 551 3756, Veli-Pekka Karvinen 029 551 2667, kansantalous.suhdanteet@stat.fi
Director in charge: Ville Vertanen
Updated 3.6.2016
Official Statistics of Finland (OSF):
Quarterly national accounts [e-publication].
ISSN=1797-9765. 1st quarter 2016,
Output of Finland's national economy continued growing in January to March
. Helsinki: Statistics Finland [referred: 16.6.2026].
Access method: http://stat.fi/til/ntp/2016/01/ntp_2016_01_2016-06-03_kat_001_en.html