

Published: 19 October 2012
Households’ indebtedness ratio rose to 117.8 per cent in the second quarter of 2012
In the second quarter of 2012, households’ loan raising almost doubled from the previous quarter to EUR 2.3 billion. Thus, households’ indebtedness ratio continued its steady growth, reaching 117.8 per cent. Households’ net financial assets diminished by EUR 4.6 billion in the second quarter of 2012. The second main reason for the decrease in net financial assets was falling stock market prices which lowered the value of the shares and mutual fund shares held by households by a total of EUR 3.0 billion. These data derive from Statistics Finland’s financial accounts statistics.
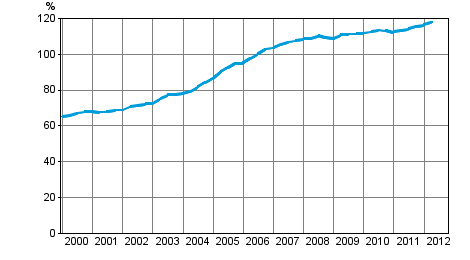
Households' indebtedness ratio
The pace of households’ indebtedness turned, for the weakened growth of past several quarters strengthened again as loan interest rates fell even further. Households’ debts grew by 1.8 per cent, pushing the stock of debts to EUR 129.7 billion.
Households’ indebtedness ratio also continued to rise in the second quarter. Households’ indebtedness ratio is calculated as the ratio of their loan debts at end of a quarter to their total disposable income during the preceding four quarters. Indebtedness ratio went up by 1.3 percentage points from the previous quarter. From the 65.1 per cent where it stood in the first quarter of 2000, the indebtedness ratio has now gone up to 117.8 per cent, having made a new record in almost every quarter since then.
Strong fluctuations in stock market prices also continued in the second quarter of 2012. The rising that was seen in the previous quarter now turned to decline, which was also seen as fallen value of the quoted shares and mutual fund shares held by households. Although households’ net investments in shares actually grew, the fall in share prices was seen as holding losses from the quoted shares held by them. The value of the quoted shares held by households fell by 9.4 per cent. The same development was also seen in mutual fund shares, for which the percentage of the fall was, however, more moderate at 4.1 per cent. The EUR 0.5 billion drop in deposits in the previous quarter proved temporary as they now grew again by EUR 1.5 billion to EUR 81.2 billion. The share of deposits of households’ total financial assets rose to almost 37 per cent.
All in all, households’ debts grew by roughly as much as their assets decreased. The combined effect led to 4.9 per cent reduction in household’s net financial assets. At the end of the second quarter of 2012, households’ net financial assets, i.e. difference between their financial assets and liabilities, amounted to EUR 90.9 billion.
Non-financial corporations increased their debt financing quite significantly by EUR 7.8 billion. This means that their debt financing went up by 3.8 per cent to EUR 210.4 billion. Debt was pushed up especially by increasing loan taking. The loan stock grew by EUR 6.6 billion. The stock of debt securities issued by non-financial corporations, in turn, rose by EUR 1.1 billion. At the same time as non-financial corporations increased their debt financing they also withdrew their assets from deposits which decreased by 4.1 per cent to EUR 26.4 billion.
Source: Financial accounts, Statistics Finland
Inquiries: Saara Roine 09 1734 3325, rahoitus.tilinpito@stat.fi
Director in charge: Ari Tyrkk�
Publication in pdf-format (253.5 kB)
- Tables
-
Tables in databases
Pick the data you need into tables, view the data as graphs, or download the data for your use.
Appendix tables
- Figures
Updated 19.10.2012
Official Statistics of Finland (OSF):
Financial accounts [e-publication].
ISSN=1458-8145. 2nd quarter 2012. Helsinki: Statistics Finland [referred: 6.7.2025].
Access method: http://stat.fi/til/rtp/2012/02/rtp_2012_02_2012-10-19_tie_001_en.html