Published: 21 October 2009
Electricity production with renewable energy sources grew by 15 per cent in 2008
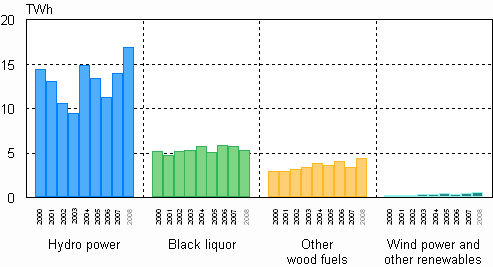
Electricity production with renewable energy sources grew by 15 per cent in 2008 from the previous year, as the use of wood fuels turned upwards and production of hydro power kept growing, reaching new records. Thirty-one per cent of the electricity needed by Finland was produced with renewable energy sources. In the production of renewable electricity hydro power accounts for 60 per cent, black liquor from the forest industry for 19 per cent and wood fuels for 16 per cent.
Electricity production with renewable energy sources 2000-2008

In 2008, total electricity consumption in Finland amounted to 87.2 terawatt hours (TWh) or billion kilowatt hours (kWh). Of this consumption, 85 per cent was covered by domestic production and the remaining 15 per cent by imported electricity. Electricity is imported to Finland from the Nordic countries, Russia and Estonia.Electricity is also exported from Finland to the Nordic countries and Estonia.
In 2008, the volume of electricity produced in Finland amounted to 74.5 TWh. The volume was 3 per cent down on the year before. The production of district heat stayed on level with the previous year, and industrial heat production was four per cent down on the year before. District heat production amounted to 33.4 TWh and that of industrial heat to 59.4 TWh.
Thirty-six per cent of electricity was produced with renewable energy sources, 30 per cent with nuclear power and 27 per cent with fossil fuels. In electricity production, hydro power accounted for 23 per cent, natural gas for 15 per cent and coal for 11 per cent.
In terms of water conditions, the year 2008 was favourable in the Nordic countries; domestic production of hydro power grew by 21 per cent. The production of electricity with wood fuels grew by 28 per cent. The production of wind power went up by 38 per cent from the year before. The production of electricity with coal diminished by 37 per cent, and that produced with peat by 30 per cent. The consumption of both fell steeply in both combined heat and power plants and condensing power plants. The production of nuclear power decreased by 2 per cent.
Electricity produced with Nordic hydro power was amply available, so the production of domestic condensing power fell steeply by more than a third. The volume of electricity generated in combined heat and power production decreased by one per cent.
Combined heat and power production remained as the most significant mode of electricity generation; it accounted for 36 per cent of all electricity produced in 2008.
The past few years have been milder than the average, and in 2008 the need of heating energy remained on level with the year before. By contrast, the consumption of heat for industrial processes fell from the level of the year before due to the economic recession and decreased industrial production capacity.
Electricity and heat production by production mode in 2008
| Electricity, TWh | District heat, TWh | Industrial heat, TWh | Total fuels used, PJ 1) | |
| Separate production of electricity | ||||
| - Hydro power | 16,9 | – | – | – |
| - Wind power | 0,3 | – | – | – |
| - Nuclear power | 22,1 | – | – | – |
| - Condensing power 2) | 8,8 | – | – | 87,9 |
| - Total | 48,0 | – | – | 87,9 |
| Combined heat and power production | 26,5 | 25,5 | 47,3 | 437,7 |
| Separate heat production | – | 7,9 | 12,1 | 85,7 |
| Total production | 74,5 | 33,4 | 59,4 | 611,3 |
| Net imports of electricity | 12,8 | – | – | – |
| Total | 87,2 | 33,4 | 59,4 | 611,3 |
2) Condensing power includes condensing power plants, shares of condensing electricity of combined heat and power production plants, and peak gas turbines and similar separate electricity production plants.
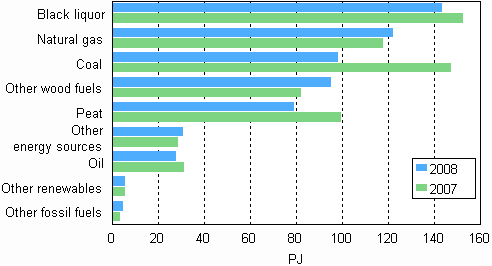
The use of fuels in the production of electricity and heat decreased by 9 per cent in 2008. The use of coal and peat declined most, or by 33 and 20 per cent respectively. The use of oil and black liquor from forestry decreased as well. By contrast, the use of wood grew by 15 per cent.
Fuel use in electricity and heat production 2007 and 2008

Source: Source: Statistics on production of electricity and heat, Statistics Finland
Inquiries: Minna Niininen 09 1734 3549, energia@tilastokeskus.fi
Director in charge: Leena Storgårds
Publication in pdf-format (291.9 kB)
- Tables
-
Tables in databases
Pick the data you need into tables, view the data as graphs, or download the data for your use.
Appendix tables
- Table 01. Electricity and heat production by production mode and fuel in 2008 (21.10.2009)
- Table 02. Fuel use in electricity and heat production, TJ (21.10.2009)
- Table 03. Supply and production of electricity, GWh (21.10.2009)
- Table 04. District heat production, GWh (21.10.2009)
- Table 05. Industrial heat production, GWh (21.10.2009)
- Figures
-
- Figure 01. Electricity production by energy sources 2008 (21.10.2009)
- Figure 02. Electricity production by energy type 2000 - 2008 (21.10.2009)
- Figure 03. Electricity production by production mode 2000 - 2008 (21.10.2009)
- Figure 04. Electricity production with renewable energy sources 2000 - 2008 (21.10.2009)
- Figure 05. Electricity production with renewable energy sources 2000 - 2008 (21.10.2009)
- Figure 06. Heat production 2000 - 2008 (21.10.2009)
- Figure 07. District heat production by fuels 2000 - 2008 (21.10.2009)
- Figure 08. Industrial heat production by fuels 2000 - 2008 (21.10.2009)
- Figure 09. Fuel use by production mode in electricity and heat production 2008 (21.10.2009)
- Figure 10. Fuel use in electricity and heat production 2007 - 2008 (21.10.2009)
- Figure 11. Fuel use in separate electricity production 2007 - 2008 (21.10.2009)
- Figure 12. Fuel use in combined heat and power production 2007 - 2008 (21.10.2009)
- Figure 13. Fuel use in separate heat production 2007 - 2008 (21.10.2009)
Updated 21.10.2009
Official Statistics of Finland (OSF):
Production of electricity and heat [e-publication].
ISSN=1798-5099. 2008. Helsinki: Statistics Finland [referred: 29.3.2025].
Access method: http://stat.fi/til/salatuo/2008/salatuo_2008_2009-10-21_tie_001_en.html

