Published: 4 December 2017
Average age at first confinement rose in Finland to the top level of Nordic countries
According to Statistics Finland’s data on population changes, the average age at first confinement has risen exceptionally much. The average age of first-time mothers was 29.1 years in 2016 rising by 0.2 years from 2015 and by 0.4 years from 2014. The average age at first confinement in Finland has risen to the same level as in Sweden, Norway and Denmark.
Average age of first-time mothers and fathers in 1985 to 2016
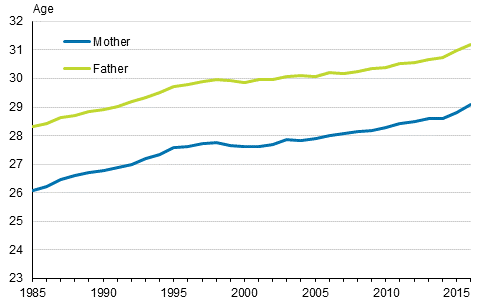
The average age of first-time fathers was 31.2 years. The age difference of first-time parents has stayed almost unchanged for decades. First-time fathers are slightly over two years older than first-time mothers.
The average age of all women having given birth was 30.8 years and the average age for becoming a father was 33.3 years in 2016.
For a long time, first-time mothers and fathers were older in the Nordic countries than in Finland, except for Iceland. In Finland, the ages of becoming mothers and fathers have grown closer to the corresponding ages in the other Nordic countries, and in 2016, the average age of becoming a mother was nearly the same in Finland, Sweden, Norway and Denmark. In Finland, Sweden and Denmark, the average age of becoming a mother was 29.1 years and in Norway 29.0 years. In Iceland, women became mothers at a clearly younger age, 27.7 years.
Average age of first-time mothers in Nordic countries in 2000 to 2016
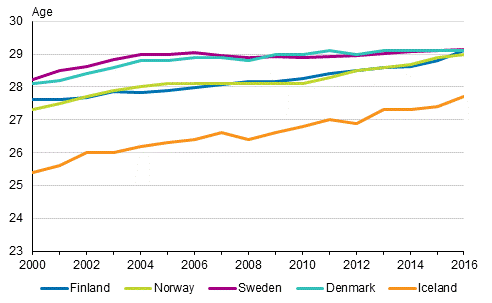
Men becoming fathers were oldest in Sweden and Norway, 31.5 years and youngest in Iceland, 30.3 years.
Having children is most common in the 30 to 34 age group
Altogether 52,814 children were born in 2016. Both the number of children born and the birth rate have decreased for six years in a row . The birth rate refers to the number of births as a proportion to the number of women of childbearing age.
Over the past six years, the birth rate has declined clearly in all age groups between 20 and 34. Having children is now most common for those aged 30 to 34, slightly more common than for those aged 25 to 29.
Having children is second most common for those aged 35 to 39 and 20 to 24. The birth rate has decreased considerably for those aged 20 to 24 in the past decades. The birth rate among those aged 40 to 44 has continued its slight growth, which started in the mid-1970s.
Fertility by age group in 1965 to 2016
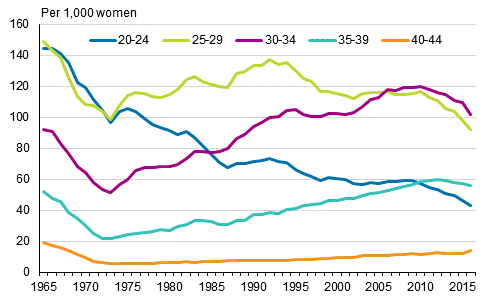
Because people are having children at a later age, an increasing number of people in the age group 35 to 39 are having their first child. When in 1990, six women per thousand women in this age group gave birth to their first child, in 2016 the corresponding figure had grown to 14.
The birth rate is also commonly measured with the total fertility rate, which indicates how many children a women would give birth to during her life time if age group-specific fertility rates remained the same as in the year on which the calculation is based.
At the fertility rate prevailing in 2016, a woman would give birth to an average of 1.57 children. Of this total fertility rate, persons aged 30 or over formed 55 per cent. At the beginning of the 1970s, their share was one-quarter.
Number of children born in marriage has decreased
Fifty-five per cent of children were born to married parents in 2016. The number and share of children born to married couples have diminished in recent decades. In 1990, three out of four children were born to married couples.
The majority of children born outside marriage were born to cohabiting parents.
In 2016, in total 29,200 children were born to married couples, which is 6,700 fewer than in 2010. In the period mentioned above, the number of marriages entered into also went down clearly. In 2016, the number of marriages entered into was 5,500 lower than in 2010. The decrease in the number of children born to married couples is naturally also affected by the decline in the total number of children born.
Live births in and outside marriage in 1990 to 2016, per cent
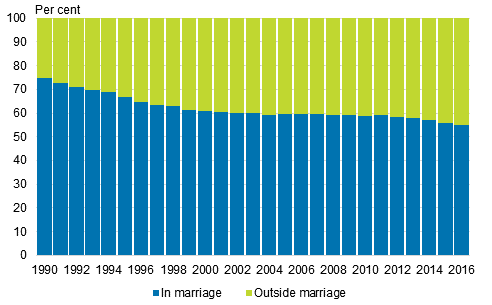
Fifty-eight per cent of firstborn children were born outside marriage in 2016, while the percentage was 38 in 1990. The threshold of 50 per cent was exceeded in 1997. Of second or higher order children, 36 per cent were born outside marriage. In 1990, the corresponding percentage was 17.
According to the most recent data of Eurostat, the Statistical Office of the European Union, the lowest number of children in European countries in 2015 were born outside marriage in relative terms in Greece, nine per cent. In relative terms, most children were born outside marriage in Iceland of European countries, 70 per cent of children born.
Share of mothers with Finnish background in the birth rate decreases further
Fertility can also be examined based on the mother's origin. The share of people with Finnish background in the total fertility rate has gradually fallen, and that of persons with foreign background has correspondingly grown. In 1990, the share of people with foreign background in the total fertility rate was very small as the share of people with foreign background was still so low in Finland.
The share of persons with foreign background in the whole country's birth rate has increased slowly over 25 years and is currently close on 13 per cent of the country’s birth rate. In the corresponding period, the share of women with foreign background in all women aged 15 to 49 has grown, however, slightly more slowly to 9.3 per cent.
Total fertility rate by mother's origin in 1990 to 2016
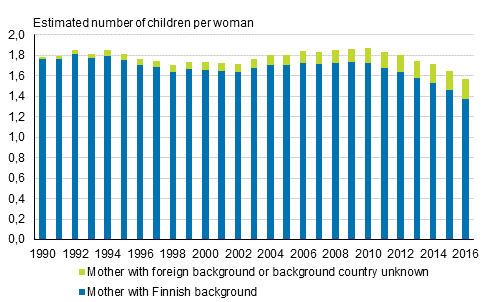
According to the whole country's birth rate in 2016, women's average number of children would be 1.57 children per women. Of this, the share of persons with Finnish background is 1.37 children per woman and of persons with foreign background 0.20 children per woman.
When we examine the decrease in the birth rate that began in 2010, we notice that only the birth rate of women of Finnish background has declined. The share of persons with Finnish background in the birth rate has gone down by 21 per cent in the past six years. By contrast, the share of persons with foreign background in the birth rate has increased by 36 per cent over the same period.
Further information about the birth rate according to origin is available on Statistics Finland's Immigrants and integration thematic pages in the section Birth rate .
Source: Births 2016. Statistics Finland
Inquiries: Miina Keski-Petäjä 029 551 3240, Marja-Liisa Helminen 029 551 3273, info@stat.fi
Director in charge: Jari Tarkoma
Publication in pdf-format (283.8 kB)
- Tables
-
Tables in databases
Pick the data you need into tables, view the data as graphs, or download the data for your use.
Appendix tables
- Quality descriptions
-
- Quality description, births 2016 (4.12.2017)
Updated 04.12.2017
Official Statistics of Finland (OSF):
Births [e-publication].
ISSN=1798-2413. 02 2016. Helsinki: Statistics Finland [referred: 13.11.2025].
Access method: http://stat.fi/til/synt/2016/02/synt_2016_02_2017-12-04_tie_001_en.html

