

Published: 24 April 2020
Producer prices for manufactured products fell by 5.6 per cent from March last year
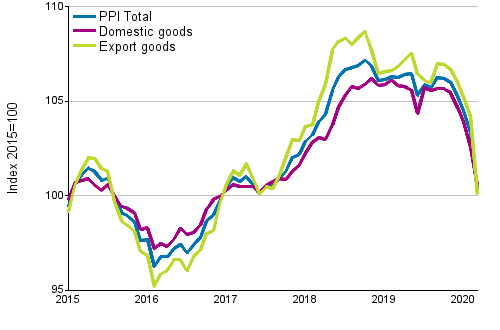
According to Statistics Finland, producer prices for manufactured products went down by an average of 5.6 per cent from March 2019 to March 2020. The producer prices for manufactured products sold on the domestic market declined by 5.0 per cent, while the producer prices of export products fell by 6.3 per cent.
Producer Price Index (PPI) 2015=100, 1/2015–03/2020
The drop in the producer prices for manufactured products was particularly attributable to fallen prices of oil products, pulp, paper, paperboard and cardboard, as well as electricity from March 2019.
The export price index fell by 6.4 per cent and the import price index by 7.0 per cent in the year. The basic price index for domestic supply went down by 3.9 per cent. The basic price index for domestic supply including taxes fell by 3.9 per cent.
The decrease in the export price index was in particular affected by lower prices of oil products, pulp, paper, paperboard and cardboard compared to March last year. The fall in the import price index was, in turn, especially attributable to reductions in the prices of oil products and electricity.
From February to March, producer prices for manufactured goods fell by 3.0 per cent. Producer prices were particularly depressed by the drop in the prices of oil products compared with the previous month.
Producer Price Indices 2015=100, March 2020
| Index | Monthly change, % | Annual change, % | |
| Producer Price Index, total | 100.3 | -3.0 | -5.6 |
| - Producer Price Index, domestic goods | 100.6 | -2.0 | -5.0 |
| - Producer Price Index, export goods | 100.1 | -3.9 | -6.3 |
| Export Price Index | 99.8 | -4.0 | -6.4 |
| Import Price Index | 101.0 | -5.0 | -7.0 |
| Basic Price Index for Domestic Supply | 103.4 | -2.4 | -3.9 |
| Basic Price Index for Domestic Supply, incl. taxes | 103.4 | -2.3 | -3.9 |
Producer Price Indices 1949=100, March 2020
| Index | Monthly change, % | Annual change, % | |
| Production Price Index | 1930 | -2.9 | -5.6 |
| Export Price Index | 1657 | -4.0 | -6.4 |
| Import Price Index | 1549 | -5.0 | -7.0 |
| Wholesale Price Index | 2288 | -2.3 | -3.9 |
Weight structures of producer price indices updated in January
Producer price indices are annual chain indices, i.e. the weight structure of the indices is updated annually in January. The latest available data from National Accounts, the statistics on industrial output and Finnish Customs’ statistics on foreign trade are used when preparing the weight structures. The latest data from the supply and use tables of National Accounts concerned the year 2015. In respect of domestic supply, imports and exports these were raised by using the 2-digit level data for 2017 that were available from National Accounts. The most detailed level product group and enterprise weights are based on data from the foreign trade statistics of Finnish Customs and statistics on industrial output for 2018. In addition to the weight structure, product categories and the enterprise sample have also been updated.
Updating of the weight structure and sample improve the quality of the indices, because with their help, structural changes in production, exports and imports can be taken into account faster.
Source: Producer Price Index 2020, March. Statistics Finland
Inquiries: Anna-Riikka Pitkänen 029 551 3466, Veli Kettunen 029 551 2693, thi.tilastokeskus@stat.fi
Director in charge: Jan Nokkala
Publication in pdf-format (389.8 kB)
- Tables
-
Tables in databases
Pick the data you need into tables, view the data as graphs, or download the data for your use.
Appendix tables
- Appendix table 1. Producer Price Indices 2015=100, index numbers and year-on-year changes, March 2020 (24.4.2020)
- Appendix table 2. Producer Price Indices 1949=100, March 2020 (24.4.2020)
- Appendix table 3. Producer Price Index 2015=100 (CPA 2015), March 2020 (24.4.2020)
- Appendix table 4. Producer Price Index 2015=100 (MIG), March 2020 (24.4.2020)
- Appendix table 5. Export Price Index 2015=100 (CPA 2015), March 2020 (24.4.2020)
- Appendix table 6. Export Price Index 2015=100 (MIG), March 2020 (24.4.2020)
- Appendix table 7. Import Price Index 2015=100 (CPA 2015), March 2020 (24.4.2020)
- Appendix table 8. Import Price Index 2015=100 (MIG), March 2020 (24.4.2020)
- Appendix table 9. Basic Price Index for Domestic Supply 2015=100 (CPA 2015), March 2020 (24.4.2020)
- Appendix table 10. Basic Price Index for Domestic Supply 2015=100 (MIG), March 2020 (24.4.2020)
- Appendix table 11. Basic Price Index for Domestic Supply 2015=100 (CPA 2015), including taxes, March 2020 (24.4.2020)
- Appendix table 12. Basic Price Index for Domestic Supply 2015=100 (MIG), including taxes, March 2020 (24.4.2020)
- Appendix table 13. Production Price Index 1949=100 (SITC), March 2020 (24.4.2020)
- Appendix table 14. Production Price Index 1949=100 (ISIC), March 2020 (24.4.2020)
- Appendix table 15. Export Price Index 1949=100, March 2020 (24.4.2020)
- Appendix table 16. Import Price Index 1949=100, March 2020 (24.4.2020)
- Appendix table 17. Wholesale Price Index 1949=100, March 2020 (24.4.2020)
- Appendix table 18. Producer Price Index 2010=100, March 2020 (24.4.2020)
- Appendix table 19. Export Price Index 2010=100, March 2020 (24.4.2020)
- Appendix table 20. Import Price Index 2010=100, March 2020 (24.4.2020)
- Appendix table 21. Basic Price Index for Domestic Supply 2010=100, March 2020 (24.4.2020)
- Appendix table 22. Basic Price Index for Domestic Supply 2010=100, including taxes, March 2020 (24.4.2020)
- Appendix table 23. Producer Price Indices for Services 2015=100, BtoAll, 1st quarter 2020 (24.4.2020)
- Appendix table 24. Producer Price Index, international comparison (24.4.2020)
- Appendix table 25. Wood pellet, consumer price (24.4.2020)
- Appendix table 26. Basic Price Index for Domestic Supply 2000=100 (NACE-TOL 2002), March 2020 (24.4.2020)
- Quality descriptions
Updated 24.4.2020
Official Statistics of Finland (OSF):
Producer price indices [e-publication].
ISSN=1799-3695. March 2020. Helsinki: Statistics Finland [referred: 13.6.2026].
Access method: http://stat.fi/til/thi/2020/03/thi_2020_03_2020-04-24_tie_001_en.html