This set of statistics has been discontinued.
Statistical data on this topic are published in connection with another set of statistics.
Data published after 5 April 2022 can be found on the renewed website.
Published: 16 December 2011
Income differentials began to grow in 2010
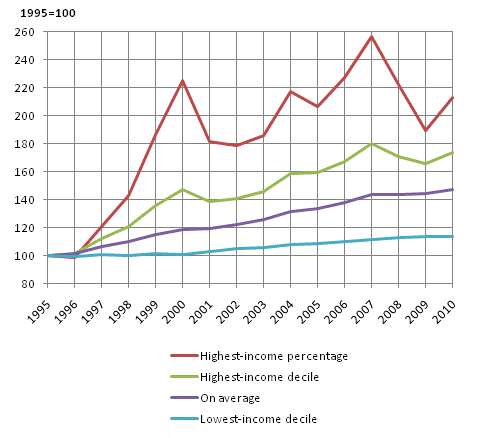
According to Statistics Finland's Total statistics on income distribution, the contraction of income differentials that had lasted for a couple of years came to an end in 2010. In 2010, the value of the Gini coefficient describing income differentials was 28.2, which is 0.6 percentage points higher than twelve months earlier. In the lowest-earning income decile, income grew by 1.5 per cent in real terms while in the highest-earning decile income grew by nearly five per cent. In the top-earning percentage of the population, income went up by over 12 per cent. Income differentials grew especially due to increased sales profits and dividend income.
Development of real income of household-dwelling population 1995-2010, per cent. Disposable monetary income per consumption unit, average

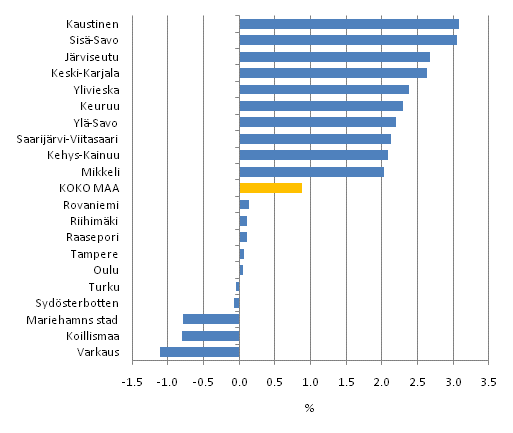
Income development was most favourable in the sub-regional unit of Kaustinen and least favourable in the sub-regional unit of Varkaus
In 2010, household-dwelling units' median disposable monetary income in the whole country was EUR 28,940, which is 0.9 per cent higher in real terms than one year earlier. Household-dwelling units in the sub-regional unit of Ålands landsbygd in Åland had by far the highest median income of EUR 40,360. Household-dwelling units with the next highest median income of EUR 33,940 were found in the sub-regional unit of Porvoo. Household-dwelling units in the sub-regional unit of Piel-isen Karjala had the lowest median disposable monetary income of EUR 22,900 in 2010.
In 2010, the annual growth of income was fastest among household-dwelling units in the sub-regional unit of Kaustinen whose median disposable monetary income was good three per cent higher in real terms than one year earlier. The growth of median income also exceeded three per cent among household-dwelling units in Sisä-Savo. In the sub-regional unit of Kaustinen, household-dwelling units' median income was EUR 31,840, while the respective income in the sub-regional unit of Sisä-Savo was clearly lower at EUR 24,740. The explanation to the better than average development of income among household-dwelling units in Kaustinen is good growth of both wage income and income from forest sales. The growth of the income of household-dwelling units in Sisä-Savo is largely explained by increased income from forest sales.
The development of income was weakest among household-dwelling units in the sub-regional unit of Varkaus, whose median income fell by good one per cent in real terms in 2010. In Koillismaa and in the sub-regional unit of Mariehamns stad, household-dwelling units' median income fell by 0.8 per cent. Household-dwelling units' median disposable monetary income was EUR 25,870 in the sub-regional unit of Varkaus, EUR 28,430 in the sub-regional unit of Koillismaa and EUR 32,010 in the sub-regional unit of Mariehamns stad. The main explanation to the poor development of income in the sub-regional unit of Varkaus is decreased wage income.
Disposable monetary income (EUR) per household-dwelling unit in 2010, median. Ten highest-income and lowest-income sub-regional units

Source: Total statistics on income distribution, Statistics Finland
Inquiries: Pekka Ruotsalainen (09) 1734 2610, Veli-Matti Törmälehto (09) 1734 3680
Director in charge: Harala Riitta
- Tables
-
Tables in databases
Pick the data you need into tables, view the data as graphs, or download the data for your use.
Updated 16.12.2011
Official Statistics of Finland (OSF):
Total statistics on income distribution [e-publication].
2010. Helsinki: Statistics Finland [referred: 22.2.2025].
Access method: http://stat.fi/til/tjkt/2010/tjkt_2010_2011-12-16_tie_001_en.html

