

Published: 15 June 2020
Turnover in industry decreased by 10.4 per cent in April
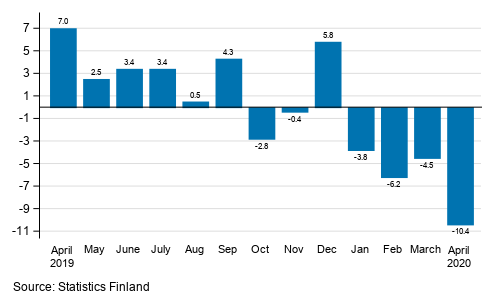
According to Statistics Finland, working day adjusted turnover in industry (TOL BCD) decreased in April by 10.4 per cent year-on-year. Among the main industries, turnover decreased most in the chemical industry, by 22.7 per cent from one year ago, which was influenced by the drop in the price of oil in addition to the exceptional situation caused by the coronavirus. Seasonally adjusted turnover in industry (TOL BCD) fell by 3.0 per cent compared with March.
Annual change in working day adjusted turnover in manufacturing (BCD), % (TOL 2008)
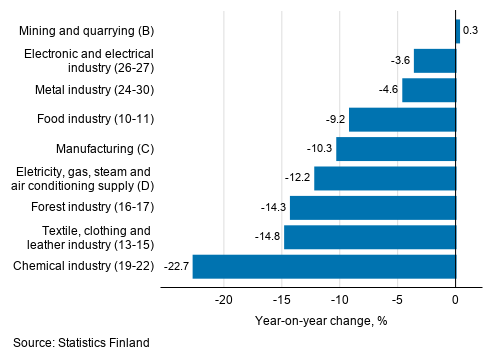
The exceptional situation caused by the coronavirus had an effect in April on the turnover of manufacturing not only in the chemical industry but also in other main industries. Turnover in the textile, clothing and leather industry was 14.8 per cent lower and in the forest industry 14.3 per lower than in April one year earlier. The turnover of electricity, gas, steam and air conditioning supply declined by 12.2 per cent and that of the food industry by 9.2 per cent from one year back. The turnover of the metal industry went down by 4.6 per cent and that of the electrical and electronics industry by 3.6 per cent. Turnover grew slightly only in mining and quarrying, by 0.3 per cent from one year ago.
Annual change in working day adjusted turnover in manufacturing by industry, April 2020, % (TOL 2008)
Export turnover decreased most in the forest industry in March
Among the main industries, export turnover adjusted for working days decreased in March most in the forest industry, by 22.5 per cent, and in the chemical industry, by 16.9 per cent from one year ago. In addition, export turnover in the textiles, clothing and leather industry was 9.0 per cent lower than one year ago. In contrast, the export turnover of mining and quarrying increased most in March, by 11.4 per cent year-on-year. Export turnover also grew in the industry of mining and quarrying, by 6.9 per cent, in the food industry, by 3.9 per cent, and in the electrical and electronics industry, by 2.8 per cent year-on-year.
Annual change in working day adjusted export turnover and domestic turnover in manufacturing by industry, March 2020, % (TOL 2008)
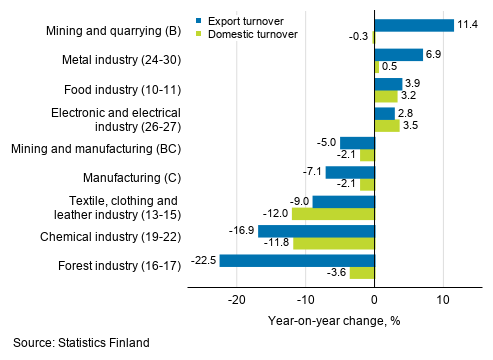
Among the main industries, turnover in Finland decreased most in March in the textile, clothing and leather industry, by 12.0 per cent, and in the chemical industry, by 11.8 per cent from the previous year. In turn, the domestic turnover of the electrical and electronics industry grew by 3.5 per cent and that of the food industry by 3.2 per cent.
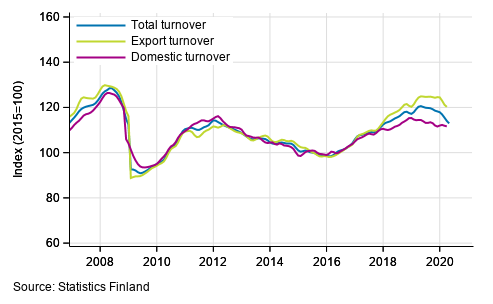
Trend series of turnover, export turnover and domestic turnover in manufacturing (BC), January 2007 to March-April 2020, % (TOL 2008)
The index of turnover in industry describes enterprises whose main industry is manufacturing. The calculation of the indices is based on the Tax Administration’s self-assessed tax data which are supplemented with data obtained with Statistics Finland’s sales inquiry. The monthly turnovers of manufacturing enterprises can vary considerably, especially in the metal industries. The variation is mainly due to invoicing practices. The final invoice for major machinery deliveries and projects may be recorded in the sales of one month, even if the delivery had required the work of several months or years.
The factors caused by the variation in the number of weekdays are taken into account in adjustment for working days. This means taking into consideration the lengths of months, different weekdays and holidays. In addition, seasonal variation is eliminated from seasonally adjusted series, on account of which it makes sense to compare observations of two successive months as well.
In terms of turnover, data for the latest month are preliminary and are released at a delay of around six weeks. The data may become significantly revised particularly on more detailed industry levels in coming months. Export turnover and domestic turnover are, for the time being, still released at a delay of two and a half months.
Source: Index of turnover in industry 2020, April, Statistics Finland
Inquiries: Maija Sappinen 029 551 3348, Heli Suonio 029 551 2481, myynti.teollisuus@stat.fi
Director in charge: Mari Yl�-Jarkko
Publication in pdf-format (341.4 kB)
- Tables
-
Tables in databases
Pick the data you need into tables, view the data as graphs, or download the data for your use.
Appendix tables
- Figures
- Revisions in these statistics
-
- Revisions in these statistics (15.6.2020)
Updated 15.6.2020
Official Statistics of Finland (OSF):
Index of turnover in industry [e-publication].
ISSN=1798-596X. April 2020. Helsinki: Statistics Finland [referred: 16.2.2026].
Access method: http://stat.fi/til/tlv/2020/04/tlv_2020_04_2020-06-15_tie_001_en.html