

Published: 30 June 2020
Prices of old dwellings in housing companies rose on annual level in Helsinki and Tampere
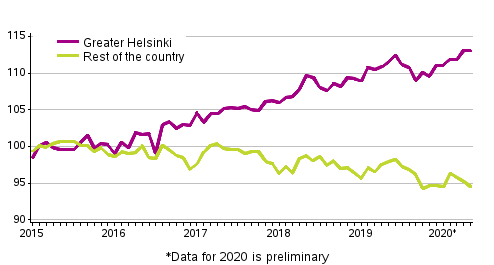
According to Statistics Finland's preliminary data, prices of old dwellings in housing companies rose by 1.4 per cent in Greater Helsinki compared to May 2019 and decreased by 3.5 per cent in the rest of Finland. Compared to April, prices remained nearly unchanged in the whole country. Based on transactions made through real estate agents, around 30 per cent fewer transactions of old dwellings in housing companies were made in May compared with the corresponding period last year.
Development of prices of old dwellings in housing companies by month, index 2015=100
Compared with the corresponding period of last year, preliminary data published monthly indicate that prices fell most in Western Finland and of towns in Oulu, where they were on a higher level than usual one year ago.
Compared with 2015, prices have fallen most in Eastern Finland, by around 17 per cent, in Western and Northern Finland by around four per cent. In Southern Finland prices have gone up by about seven per cent.
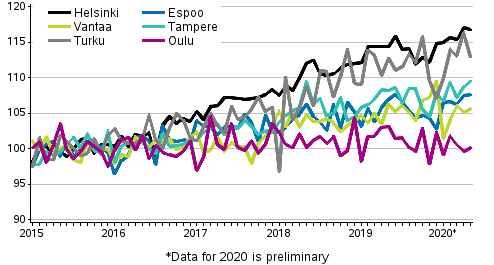
According to preliminary data, of large towns prices rose by two per cent in Helsinki and by 1.3 per cent in Tampere compared with the corresponding period of last year. Prices in Espoo, Vantaa and Turku prices remained almost unchanged compared with the corresponding period of last year.
Development of prices of old dwellings in housing companies by month in large cities in 2015 to 2020M05
Prices per square metre of old dwellings in housing companies, May 2020 1)
| Area | Price, EUR/m� | Index 2015=100 | Monthly change, % | Yearly change, % |
| Whole country | 2,129 | 103,2 | -0,4 | -1,1 |
| Greater Helsinki | 3,846 | 113,0 | -0,1 | 1,4 |
| Rest of the country (whole country - Greater Helsinki) | 1,630 | 94,5 | -0,7 | -3,5 |
| Satellite municipalities 2) | 2,093 | 94,8 | 1,4 | -2,7 |
| Helsinki | 4,396 | 116,8 | -0,3 | 2,1 |
| Espoo-Kauniainen | 3,652 | 107,6 | 0,1 | 0,6 |
| Vantaa | 2,752 | 105,7 | 0,5 | -0,6 |
| Tampere | 2,624 | 109,6 | 0,7 | 1,3 |
| Turku | 2,092 | 113,0 | -2,9 | 0,2 |
| Oulu | 1,801 | 100,1 | 0,5 | -3,0 |
2) Satellite municipalities = Hyvink��, J�rvenp��, Kerava, Kirkkonummi, Nurmij�rvi, Riihim�ki, Sipoo, Tuusula and Vihti
When the monthly statistics on prices of dwellings in housing companies are published, they cover approximately 70 per cent of all transactions made in the latest statistical month. The monthly data become revised during the following months so that the final data for the year are published in the release concerning the first quarter of the following year. Further information about data revisions can be found in separate tables.
Starting from March 2020, the data used in the statistics on prices of old dwellings in housing companies are the Tax Administration's data on dwellings (data on ownership of dwellings in housing companies). Data on dwellings should not be used to assess the activity of transactions in the latest period.
The numbers of old dwellings in housing companies sold through real estate agents are based on the data from the price monitoring service of the Central Federation of Finnish Real Estate Agencies.
Source: Prices of dwellings in housing companies, Statistics Finland
Inquiries: Petri Kettunen 029 551 3558, Elina Vuorio 029 551 3385, asuminen.hinnat@stat.fi
Director in charge: Mari Yl�-Jarkko
Publication in pdf-format (341.4 kB)
- Tables
-
Tables in databases
Pick the data you need into tables, view the data as graphs, or download the data for your use.
Appendix tables
- Quality descriptions
- Revisions in these statistics
-
- Revisions in these statistics (30.6.2020)
Updated 30.6.2020
Official Statistics of Finland (OSF):
Prices of dwellings in housing companies [e-publication].
ISSN=2323-8801. May 2020. Helsinki: Statistics Finland [referred: 15.2.2026].
Access method: http://stat.fi/til/ashi/2020/05/ashi_2020_05_2020-06-30_tie_001_en.html