

Published: 18 September 2020
Financial position of general government weakened by EUR 5.3 billion
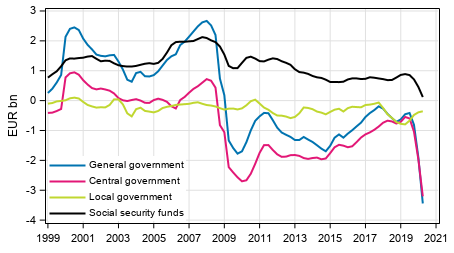
In the second quarter of 2020, general government's consolidated total revenue decreased by EUR 2.8 billion compared with the corresponding quarter of the previous year. Consolidated total expenditure increased by EUR 2.5 billion from the previous year’s corresponding quarter. The difference between revenue and expenditure, that is, the net borrowing of general government rose by EUR 5.3 billion. Total revenue decreased by 4.6 per cent from the previous quarter. Total expenditure grew by 5.0 per cent from the previous quarter. In the second quarter of 2020, the general government deficit (net borrowing) stood at EUR 3.7 billion. These data derive from Statistics Finland’s statistics on general government revenue and expenditure by quarter. General government is comprised of central government, local government and social security funds.
General government’s net lending (+) / net borrowing (-), trend
Changes from the respective quarter of the year before
Examinations of year-on-year changes are made with figures unadjusted for seasonal variation. The corona crisis increased expenditure and decreased revenue significantly. In the second quarter, central government's total revenue amounted to EUR 14.1 billion and total expenditure was EUR 18.1 billion. Central government's total revenue went down by 13.2 per cent from the respective quarter of the year before. The revenue items that decreased most were income taxes, taxes on production and imports, and property income. Total expenditure increased by 17.7 per cent from the respective quarter of the year before. The expenditure items that grew most were subsidies paid and current transfers paid to general government. The difference between revenue and expenditure, that is, the central government deficit was EUR 4.0 billion in the second quarter.
Local government's total revenue was EUR 13.2 billion in the second quarter. Compared to the corresponding quarter of the previous year it grew by 1.6 per cent. Of revenue, most increase was recorded in current transfers from central government. Sales of non-market products decreased most. In the second quarter of the year, local government's total expenditure was EUR 13.1 billion. It decreased by 1.6 per cent. In expenditure, the fall was biggest in intermediate consumption. The difference between revenue and expenditure, that is, the surplus (net lending) of local government was EUR 0.1 billion, while local government was EUR 0.4 billion in deficit in the corresponding quarter of the previous year.
Social security funds include employment pension schemes and other social security funds. In the second quarter, total revenue of employment pension schemes amounted to EUR 7.4 billion and total expenditure to EUR 7.3 billion. Total revenue fell by EUR 0.5 billion or by 6.4 per cent from the corresponding quarter in the year before and total expenditure increased by EUR 0.2 billion or by 3.4 per cent. The effects of corona are visible, for example, in social security contributions received, which went down by EUR 0.3 billion, or 4.8 per cent, in the second quarter from one year ago. The revenue items that grew most were reinvested earnings on foreign direct investments and the expenditure items that grew most were paid pensions. The difference between revenue and expenditure, that is, the surplus (net lending) of employment pension schemes went down by around EUR 0.7 billion from the corresponding quarter in the previous year and amounted to EUR 0.1 billion.
Other social security funds' total revenue was EUR 5.4 billion in the second quarter. Total revenue increased by 12.0 per cent from the corresponding quarter of one year ago. Current transfers received by the sector had most effect on the change in revenue, they grew by EUR 514 million, or by 16.0 per cent, from the year before. The expenditure of other social security funds amounted to EUR 5.2 billion and it increased by 15.5 per cent from the quarter last year. Expenditure grew most due to paid social benefits other than social transfers in kind. They grew by EUR 685 million, or 19.8 per cent, from one year ago, which is especially due to the strong growth in unemployment benefit expenses. The exceptional lags in the processing of applications for unemployment benefit in the spring are reflected in the payment-based data used as the source for unemployment benefit expenses. However, social benefits other than social transfers in kind in the statistics are recorded on accrual basis based on Statistics Finland's estimate. The difference between revenue and expenditure, that is, the surplus (net lending) of other social security funds was EUR 149 million in the second quarter.
Changes from the previous quarter
Examinations of changes compared with the previous quarter are made with seasonally adjusted figures. Central government's total revenue decreased by 7.0 per cent from the previous quarter. Central government's total expenditure increased by 9.5 per cent from the previous quarter.
Local government's total revenue went down by 0.1 per cent from the previous quarter. Total expenditure decreased by 0.5 per cent.
Employment pension schemes' total revenue went down by 2.5 per cent and total expenditure by 2.0 per cent from the previous quarter. Other social security funds' total revenue increased by 5.6 per cent and total expenditure grew by 11.3 per cent from the previous quarter.
The data for the two latest years are preliminary and will become revised as annual national accounts data are revised. Seasonally adjusted and trend time series have been calculated with the Tramo/Seats method. Seasonally adjusted and trend time series always become revised against new observations irrespective of whether the original time series becomes revised or not. Further information on the seasonal adjustment method: http://www.tilastokeskus.fi/til/tramo_seats_en.html As the time series of annual national accounts become revised, the time series of this set of statistics will also be revised. These data are based on the data sources available by 10 September 2020. The data will be next revised on 18 December 2020.
Source: General government revenue and expenditure,2nd quarter 2020. Statistics Finland
Inquiries: Jouni Pulkka 029 551 3532, Jens Melfsen 029 551 2578, rahoitus.tilinpito@stat.fi
Head of Department in charge: Mari Yl�-Jarkko
Publication in pdf-format (423.2 kB)
- Tables
-
Tables in databases
Pick the data you need into tables, view the data as graphs, or download the data for your use.
Appendix tables
- Figures
-
- Appendix figure 1. Social benefits other than social transfers in kind (18.9.2020)
- Appendix figure 2. Actual social contributions (18.9.2020)
- Appendix figure 3.Current Taxes on Income, Wealth, etc., trend (18.9.2020)
- Appendix figure 4. Taxes on Production and Imports (18.9.2020)
- Appendix figure 5. Total revenue, trend (18.9.2020)
- Appendix figure 6. Total expenditure, trend (18.9.2020)
- Appendix figure 7. Final Consumption expenditure, trend (18.9.2020)
- Appendix figure 8. Gross savings, trend (18.9.2020)
- Revisions in these statistics
-
- Revisions in these statistics (18.9.2020)
Updated 18.09.2020
Official Statistics of Finland (OSF):
General government revenue and expenditure by quarter [e-publication].
ISSN=1797-9382. 2nd quarter 2020. Helsinki: Statistics Finland [referred: 17.12.2024].
Access method: http://www.stat.fi/til/jtume/2020/02/jtume_2020_02_2020-09-18_tie_001_en.html