

Published: 15 March 2021
Exports at a lower level than in 2019 despite recovery at the end of the year
During 2020, exports were constantly below the previous year's level and the last quarter of the year was no exception to this. However, differing from the previous quarters of 2020, exports of goods and services improved in the past quarter. However, even in previous years the level of exports has been at its highest in the last quarter of each year, but it is exceptional for exports of services to grow even higher than imports of services in the past quarter. Imports also grew somewhat from the previous quarters of 2020, but less than exports. These data derive from Statistics Finland's statistics on international trade in goods and services, which are part of balance of payments .
Figure 1. Imports and exports of services quarterly
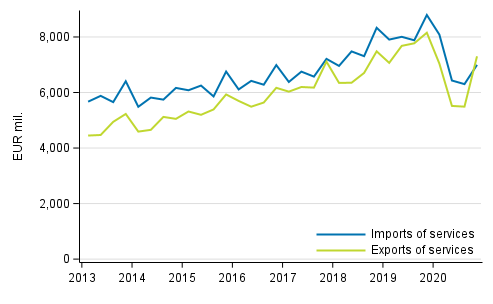
In the last quarter of 2020, exports of services were valued at EUR 7.3 billion, or EUR 0.3 billion higher than the value of imports of services. This is not typical because imports of services have always been higher than exports in recent years. The growth in service exports was mainly due to exports of telecommunication, computer and information services (TCI), which grew by EUR 0.6 billion compared with the last quarter of 2019. However, this growth was smaller than the decrease in exports of travel and transport services, so in all, the value of service exports fell by EUR 0.8 billion or 10 per cent compared with the corresponding quarter of the previous year. Service imports fell in turn by as much as 20 per cent.
In turn, goods were exported from Finland to the value of EUR 16.7 billion and imported to the value of EUR 14.4 billion. The partial recovery of exports of goods in the last quarter of 2020 was influenced by delivery of a seagoing vessel to the value of just under EUR one billion, although there was a similar delivery of a seagoing vessel in the last quarter of 2019 as well. The value of exports of goods was three per cent lower than in the last quarter of 2019, while imports of goods fell by eight per cent.
International trade in travel and transport services still low
Especially after the first quarter of 2020, the figures for travel exports and imports have been clearly lower than in 2019. In the past quarter, only EUR 0.1 billion in income was received from travel exports, that is, travel to Finland, while one year earlier the income was EUR 0.8 billion. Travel imports, i.e. travel from Finland abroad, went down even more than travel exports, as their value was still EUR 1.3 billion in the last quarter of the year before. In the last quarter of 2020, the value of travel imports also diminished to around EUR 0.1 billion like travel exports.
In addition to travel, exports of transport services also declined clearly in the previous quarter compared with one year earlier. At that time, the value of exports of transport services had still been EUR 1.1 billion, but in the past quarter it was EUR 0.5 billion. In imports of transport services, the corresponding figures were EUR 1.5 billion and EUR 1.1 billion, that is, their value also fell, even though less than transport exports.
Thus, the combined value of exports of travel and transport services decreased in total by EUR 1.2 billion from the last quarter of the year 2019, while the value of all service exports fell by good EUR 0.8 billion. In fact, the weak development in service exports can largely be explained by the fall in income from transport and travel services, which is due to the pandemic caused by the coronavirus.
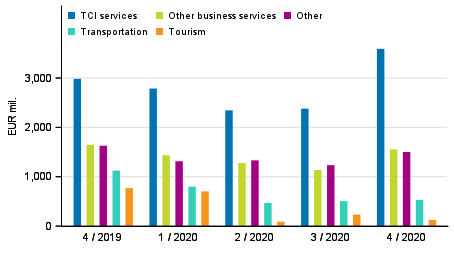
Figure 2. Exports of services by service item
Growth in exports of TCI services compensates for losses of travel and transport exports to some extent
The only item of service exports that grew significantly in the last quarter of 2020 was exports of TCI services, which grew by around one-fifth relative to the corresponding quarter of the previous year. In the past quarter, income from TCI exports amounted to EUR 3.6 billion, which was also considerably more than in the previous quarters of 2020. However, TCI exports were also then the largest of the items of Finland's service exports. Other business services were exported second most in the past quarter but only EUR 1.6 billion, or over one half less than TCI exports. Other business services include R&D services, consulting services, technical and trade-related services, for example. Exports of other business services fell by a total of around EUR 0.1 billion from one year ago. Exports of other items either fell less than that or were roughly on level with the year before.
While TCI services are now and have previously been the biggest service item in service exports, the most significant item in imports has been other business services. In the last quarter of 2019, these services were imported to the value of EUR 3.2 billion and one year later, the value was EUR 0.3 billion lower. On the other hand, there was slight growth in service imports in the imports of financial intermediation and insurance services and TCI services, as well as in charges collected for the use of intellectual property. In imports, too, the biggest decreases concerned travel and transport services, whose combined contraction explained as much as 88 per cent of the whole decline of service imports.
Exports to the United States grew exceptionally much
The biggest change in exports of goods and services in the last quarter of 2020 was the exceptional growth in exports to the United States. In relation to the last quarter of 2019, exports there grew by as much as EUR 1.7 billion. The value of exports to the United States in the previous quarter, EUR 4.1 billion, was also clearly higher than in the previous quarters of 2020. Although exports to the United States are still not on the same scale as Finland's exports to Europe, the value of which stood at EUR 14.8 billion in the last quarter of 2020, the United States has at least temporarily overtaken Sweden in the size order of export countries. Thus, exports of goods and services to Sweden amounted to EUR 2.9 billion in the past quarter, which is EUR 0.1 billion less than in the last quarter of 2019. Then clearly more goods and services were exported from Finland to Sweden than to the United States.
Compared to the previous year, the value of exports to Europe decreased by EUR 2.2 billion and exports to EU Member States fell by a total of EUR 1.8 billion. The magnitude of the contraction is however influenced by the exceptionally high level of exports of goods to Italy in the last quarter of 2019. In addition to Sweden, exports to Germany and the Netherlands also fell by around EUR 0.1 billion. Exports to Russia and Great Britain in turn decreased by close on EUR 0.2 billion for both countries.
Figure 3. Exports of goods and services in balance of payments terms by area
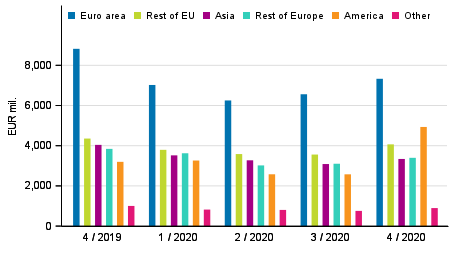
Exports to Asia also declined clearly by around EUR 0.7 billion from the year before, of which China accounted for EUR 0.1 billion. By contrast, imports from China grew, though moderately, by close on EUR 0.1 billion. In addition to exports, trade between European countries and Finland also declined clearly for imports, by EUR 2.2 billion. Here, especially imports from Russia decreased significantly, as in the past quarter those imports fell by as much as EUR 0.8 billion relative to the level of EUR 2.2 billion in the corresponding quarter of the previous year. While exports to the United States replaced the decrease in exports to other countries, nothing similar took place for imports. Imports from the United States went down by EUR 0.3 billion.
Statistics on international trade
Data on international trade have become considerably revised for 2019. As the most significant change, service exports decreased in the revision by EUR 1.1 billion and service imports by EUR 0.7 billion. Revisions were also made to factoryless production, which can be seen as changes in the country division. Further information from the press release of 26 February 2021.
The statistics on international trade in goods and services are part of balance of payments . The statistics comprise breakdowns of goods and services on a more detailed level. The guidelines and recommendations of the Balance of Payments Manual (BPM6) applied to balance of payments are consistent with the European System of Accounts (ESA 2010). National Accounts are published on quarterly and annual levels . Finnish Customs publishes data on goods trade across borders. Goods trade published by Finnish Customs is used as source data for the statistics on international trade in goods and services. Removals and additions caused by the definitions described in the quality description are made there to achieve goods trade in balance of payments terms.
Finnish Customs’ statistical service, tilastot@tulli.fi, +358 29 552 335.
Source: International trade in goods and services 2018, Statistics Finland
Inquiries: Kasperi Lavikainen 029 551 3674, Risto Sippola 029 551 3383, Marianna Mukkulainen 029 551 3405, globalisaatio.tilastot@stat.fi
Head of Department in charge: Katri Kaaja
Publication in pdf-format (278.7 kB)
- Tables
-
Tables in databases
Pick the data you need into tables, view the data as graphs, or download the data for your use.
Appendix tables
- Revisions in these statistics
-
- Revisions in these statistics (15.3.2021)
Updated 15.3.2021
Official Statistics of Finland (OSF):
International trade in goods and services [e-publication].
ISSN=2343-4244. 4th quarter 2020. Helsinki: Statistics Finland [referred: 25.4.2025].
Access method: http://stat.fi/til/tpulk/2020/04/tpulk_2020_04_2021-03-15_tie_001_en.html