2 Employment and unemployment in 2014
2.1 Men’s employment weakened in 2014
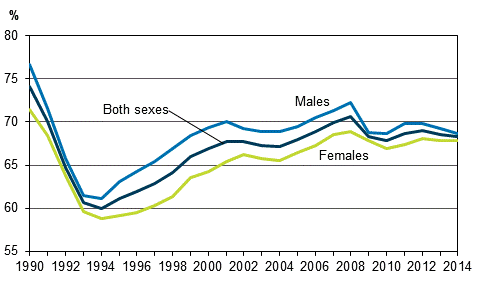
According to Statistics Finland's Labour Force Survey, the rate of employment for the population aged 15 to 64 continued to contract in 2014. At 68.3 per cent, the employment rate was 0.2 percentage points lower than in 2013. The employment rate of men was 68.7 per cent and that of women 67.9 per cent. (Figure 1.)
The weakening in the employment rate only applied to men. Men's employment rate decreased by 0.5 percentage points from the previous year while women's employment rate remained almost unchanged. The gender employment gap decreased further and was only 0.8 per cent in 2014. The difference has never been this low on the annual level before.
In Figure 1, the employment rate has been calculated for the 15 to 64 age group. The overall development of the employment rate has, in recent years, been affected by the ageing of the population as the post-war baby boom generations have moved to the 65 to 74 age group, and the population in the 15 to 64 age group has diminished.Figure 1. Employment rates by sex in 1990–2014 persons aged 15 to 64, %
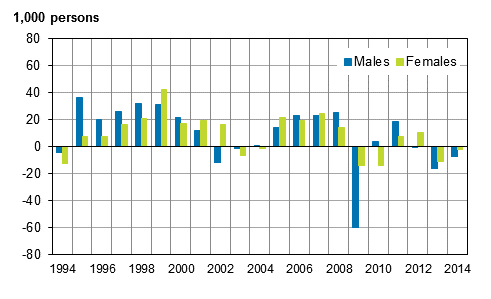
In 2014, the average number of employed persons aged 15 to 74 was 2,447,000, which was 9,000 lower than in 2013. The drop in the number of employed persons particularly applies to men, of whom 1,254,000 were employed in 2014, which was 7,000 fewer than in the previous year. In 2014, there were 1,193,000 employed women. Figure 3 shows a time series on changes in the number of employed persons by sex.
Figure 2. Number of employed persons by sex in 1992 to 2014, persons aged 15 to 74
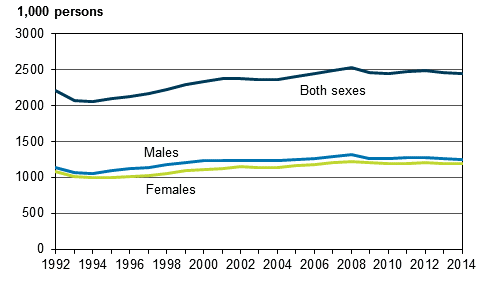
Figure 3. Change from the previous year in the number of employed persons by sex in 1994-2014, persons aged 15 to 74
The employment rate of women aged between 15 and 64 is clearly higher in Finland than the corresponding average for the EU28, which was 58.8 per cent in 2013. Men's employment rate was close to the EU28 average (69.9 per cent in 2013). Because Finnish women work less in part-time jobs than women in EU28 countries on average, the full-time equivalent employment rate of women aged between 20 and 64 is exceptionally high in Finland (67.3 per cent in 2013). In 2013, the corresponding average for women in the EU28 was 53.6 per cent. Measured in this way, only Sweden was ahead of Finland, and Estonia reached the same level as Finland in 2013.( European Comission )
Employment of ageing people improved
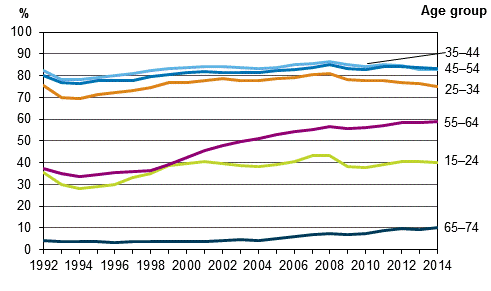
The age-group specific development of the employment rate is shown in Figure 4. In recent years, the employment rate has decreased in all other age groups except those aged over 55 whose employment rate has improved. The employment rate of those aged 55 to 64 grew by 0.6 percentage points from 2013 and stood at 59.1 per cent in 2014. In the oldest age group of those aged 65 to 74, the employment rate rose by one percentage point to 10.2 per cent.
The employment rate rose for both sexes in these two oldest age groups. Women's employment rate in 2014 was higher (61.4%) than men's employment rate (56.8%) in the 55 to 64 age group. By contrast, the employment rate of men aged 65 to 74 (13.7%) was higher than that of women (7.0%).
The employment rate among young people aged between 15 and 24 remained almost unchanged from 2013 to 2014. However, the employment rate of young men rose by 0.7 percentage points to 37.6 per cent, but that of young women decreased by one percentage point to 42.8 per cent.
The employment rate for women decreased in all other age groups except those aged over 55 and those aged between 35 and 44. This is noteworthy because in 2013 women's employment rate had declined particularly among those aged between 35 and 44 compared with the previous year.
In Finland, the employment rate of aged women is very high compared to other EU28 countries. In Finland, the employment rate of women aged 55 to 64 was 60.5 per cent in 2013 and the average for the EU28 countries was 43.3 per cent. The employment of aged men was on the average level of EU28 countries.
Figure 4. Employment rates by age group in 1992–2014, %
Number of employed persons continued decreasing in manufacturing and worker occupations
The fall in employment mainly concerned the private sector, which employed 16,000 fewer persons aged between 15 and 74 than in 2013. In the public sector, the number of employed persons grew by 5,000.
Figure 5 shows the change in the number of employed persons by industry from 2013 to 2014. The number of employed persons decreased most in manufacturing (C-E), by 18,000 persons. Employment also diminished in the construction industry (F) by 7,000 persons and in wholesale and retail trade (G) by 6,000 persons.
The drop in employment in manufacturing (C-E) was primarily directed at men, whose number decreased by 13,000 persons. In the construction industry, the weakened employment was also particularly clear among men (6,000). In trade, the decrease in employment was mainly directed at women.
The number of persons working in business activities (M, N) grew by 9,000 of which the majority were men. Growth industries for women were education (P) (an increase of 6,000 persons) and the majority of the 5,000 person increase in other service activities. Employment in human health and social work activities (Q) has grown with a couple of thousand, what is interesting is that this growth actually comes from an increase in the number of men working in the industry.
Figure 5. Change from the previous year in the number of employed persons by industry in 2013 to 2014, persons aged 15 to 74
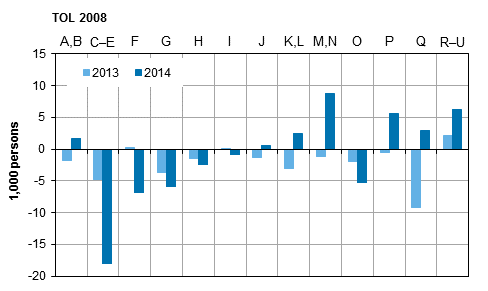
Industries (Standard Industrial Classification TOL 2008)
| A, B | 01–09 | Agriculture, forestry and fishing; mining and quarrying |
| C-E | 10–39 | Manufacturing; electricity, gas, steam and air conditioning and water supply; sewerage and waste management |
| F | 41–43 | Construction |
| G | 45–47 | Wholesale and retail trade; repair of motor vehicles and motorcycles |
| H | 49–53 | Transportation and storage |
| I | 55–56 | Accommodation and food service activities |
| J | 58–63 | Information and communication |
| K, L | 64–68 | Financial, insurance and real estate activities |
| M, N | 69–82 | Professional, scientific and technical activities; administrative and support service activities |
| O | 84 | Public administration and defence; compulsory social security |
| P | 85 | Education |
| Q | 86–88 | Human health and social work activities |
| R–U | 90–99 | Arts, entertainment and recreation; other service activities |
Examined by socio-economic group, the drop in employment among employees focused on worker occupations. The number of employed persons in worker occupations decreased by 23,000 persons between 2013 and 2014. The number of lower-level employees also decreased a little but the number of upper-level employees grew by 3,000 persons.
Men work more often in worker occupations than as upper-level or lower-level employees. The weakening in men's employment is visible in worker occupations, where the number of employees has decreased by 19,000 persons from 2013. By contrast, the number of employed men working as lower-level employees increased by 5,000 persons from 2013. The number of men working as upper-level employees remained unchanged.
Nearly 60 per cent of women work in occupations that are classified as lower-level employees. The number of employed women has decreased in this group by 7,000 persons since 2013. The number of women working in worker occupations has also decreased by 5,000 persons. In 2014, altogether 4,000 more women worked as upper-level employees than in 2013.
Fewer employees, more self-employed persons
The weakening of employment from 2013 to 2014 applied to employees aged between 15 and 74. In 2014, there were 2,105,000 employees, or 22,000 fewer than in 2013. The number of male employees decreased by 14,000 and was 1,023,000 in 2014. The number of female employees amounted to 1,082,000, which was 8,000 lower than one year previously.
By contrast, the number of self-employed persons has grown among those aged 15 to 74. In 2014, there were 343,000 self-employed entrepreneurs or unpaid family workers in Finland, which means that the number had grown by 12,000 from 2013. The share of self-employed persons and unpaid family workers among the employed aged between 15 to 74 was 14 per cent in 2014.
There were 104,000 employer entrepreneurs in 2014. There were 5,000 more of them than in 2013. The number of sole entrepreneurs (incl. self-employed in agriculture) grew by 7,000 persons from the previous year and amounted to 227,000 in 2014. There were 12,000 unpaid family workers. The number of self-employed entrepreneurs and unpaid family workers grew both among men and women almost by the same number, even though men work as entrepreneurs (incl. unpaid family members) clearly more often (231,000) than women (111,000).
The different forms of working among employed persons and their distribution are examined in more detail at the end of Section 2.
Number of hours worked remained unchanged
In total, employed persons worked 4.0 billion hours in 2014, which as roughly the same as in 2013. In 2014, the average annual number of hours worked by an employed person was 1,617, whereas in 2013 the respective figure was 1,613 hours.
In 2014, the number of underemployed persons was 127,000, which was 8,000 more than in 2013. Five per cent of all employed persons were underemployed. Underemployed persons refer to persons working involuntarily part-time or a shortened working week or that have not had work due to a low number of orders or customers or due to being temporarily laid off.
2.2 Number of unemployed increased in 2014
The growth in unemployment continued in 2014. The number of unemployed persons aged between 15 and 74 increased by 13,000 from 2013, which was almost as much as from 2012 to 2013. Unemployed persons numbered 232,000 in 2014. Of them, 129,000 were men and 103,000 women. The number of unemployed men grew by 7,000 persons, and that of unemployed women by 6,000 persons.
The rate of unemployment rose to 8.7 per cent in 2014. The unemployment rate of men was 9.3 per cent and that of women 8.0 per cent. Growth for both sexes was 0.5 percentage points year-on-year. The gender unemployment gap remained the same as in 2013, at 1.3 percentage points.
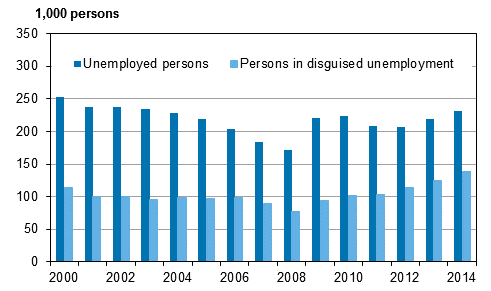
In addition to the unemployed, there were 138,000 persons defined as being in disguised unemployment among people of working-age (15 to 74). Disguised unemployment refers to persons, who would and could have accepted work, but had not looked for it. The number of persons in disguised unemployment grew by 14,000 from 2013, i.e. by roughly the same as the number of unemployed persons. Of the persons in disguised unemployment, 77,000 were men and 61,000 women. Of the persons in disguised unemployment, 22,000 were aged between 65 and 74 in 2014, which was 4,000 persons more than in the year before.
The combined number of unemployed persons and persons in disguised unemployment was 371,000 in 2014, i.e. 27,000 more than in 2013.
Figure 6. Unemployed persons and persons in disguised unemployment in 2000 to 2014, persons aged 15 to 74
The youth unemployment rate also grew from 2013. In 2014, the unemployment rate for young people aged 15 to 24 was 20.5 per cent, which was 0.6 percentage points higher than in 2013. The unemployment rate of young men was higher (22.8%) than that of young women (18.4%). Compared with 2013, the unemployment for young men remained almost unchanged but that of young women rose by 1.3 percentage points. In the age group 15 to 24, there were 68,000 unemployed in 2014.
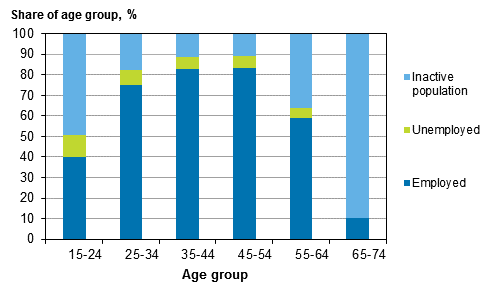
Because only one-half of young people belong to the labour force, youth unemployment of 20 per cent does not mean that one in five young persons would be unemployed. The share of the unemployed of the entire 15 to 24 age group was 10.4 per cent in 2014. Among men, the share was 11.1 per cent and among women 9.6 per cent. In other words, around one in ten young persons were unemployed in 2014.
Figure 7. Unemployment rates by age group in 1992 to 2014, %
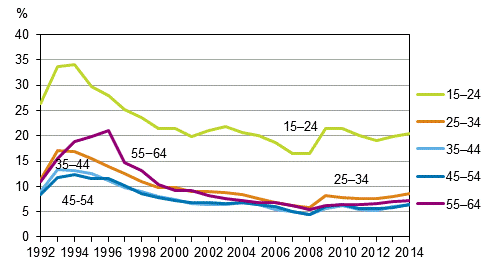
Figure 8. Shares of employed, unemployed and inactive of age group in 2014, %
The prevalence of unemployment varies by level of education. The unemployment rate of persons without post-basic level education was in 2013 more than triple (15.9%) compared to persons with tertiary level degrees (4.7%). The difference is especially clear for women: the unemployment rate for women without post-basic level education was 17.5 per cent, while the corresponding share for women with tertiary level degrees was 4.3 per cent. The unemployment rate for men without post-basic level education was 14.9 per cent and for those with tertiary level degrees it was 5.1 per cent.
Number of laid off persons the same as in the previous year
An average of 16,000 employees were laid off in 2014, which was the same as in the previous year (Table 1). The lay-offs mainly concerned men (12,000). Of the persons laid off in 2014, 36 per cent were laid off for a fixed period and 64 per cent for the time being.
In the Labour Force Survey, 30 per cent of the laid off persons were defined as employed, 29 per cent as unemployed and 41 per cent as being in the inactive population. More information about the definition of the labour market status of a laid-off person can be found at: http://tilastokeskus.fi/til/tyti/tyti_2009–04–28_men_006.html (only Finnish).
Table 1. Laid-off persons aged 15–74 by quarter in 2010–2014
| Quarter | Year | ||||
| 2010 | 2011 | 2012 | 2013 | 2014 | |
| I | 35,000 | 18,000 | 17,000 | 21,000 | 23,000 |
| II | 19,000 | 11,000 | 10,000 | 13,000 | 12,000 |
| III | 15,000 | 9,000 | 9,000 | 14,000 | 10,000 |
| IV | 14,000 | 11,000 | 11,000 | 15,000 | 16,000 |
| Annual average | 21,000 | 12,000 | 12,000 | 16,000 | 16,000 |
2.3 Activity rate of aged persons increased
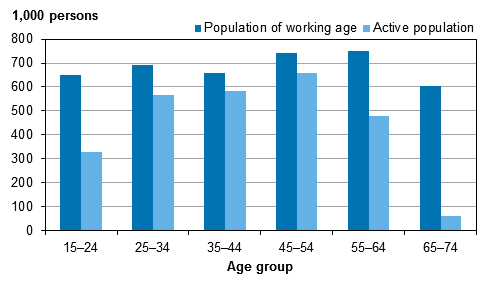
The number of population aged between 15 to 74 increased by 9,000 from 2013. In 2014, the population of working age was 4,095,000 persons. Of these persons, 2,679,000 were in the active population, i.e. the employed and unemployed, which was 3,000 more than in the year before.
The ageing of the baby boom generations is visible in that especially the population aged 65 to 74 increased. There were 26,000 more such persons in 2014 compared with the previous year. In the age group, the number of persons in the active population increased by 8,000 from 2013.
Simultaneously, the population aged 15 to 64 decreased as did the number of persons in the active population in the 15 to 64 age group.
The activity rate expresses how large a share of the population is either employed or unemployed. In 2014, the activity rate of the population aged 15 to 74 was 65.4 per cent. The share remained almost unchanged compared to 2013.
By contrast, among the population aged 15 to 64, the activity rate increased from 74.7 to 75.0 per cent in 2014. The growth concerns women: women's activity rate increased by 0.5 percentage points and was 73.9 per cent in 2014. Men's activity rate remained at 76 per cent.
The activity rate of aged people increased for both sexes from 2013. The activity rate was 63.8 percentage points for those aged 55 to 64 and 10.3 per cent for those aged 65 to 74 in 2014. Women's activity rate is higher than men's among those aged 55 to 64 but for those older than this the situation is the opposite: the activity rate of men aged 65 to 74 is higher than that of women. There are more entrepreneurs among men than women, and entrepreneurs typically continue their career longer than employees.
Among the population aged under 55, the activity rate developed differently for women and men in 2014. For young men aged 15 to 24, the activity rate increased while for young women the activity rate decreased. By contrast, in the middle age groups, the activity rate of men decreased while that of women increased.
Figure 9. Population of working age and active population by age group in 2014
2.4 Number of employment contracts of under one year’s duration decreased in 2014
No change in the number of fixed-term positions
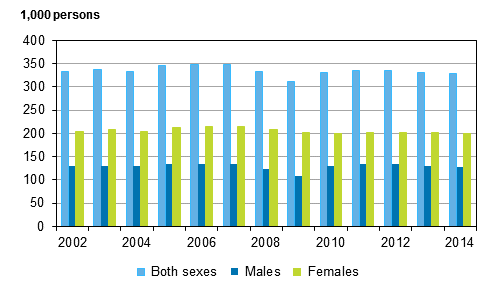
In 2014, there were on average 329,000 fixed-term employees among the population aged 15 to 74. Of these, 129,000 were men and 200,000 women. The number of fixed-term employees remained almost unchanged compared with the previous year. (Figure 10.)
Figure 10. Number of temporary employees aged 15 to 74 by sex in 2002 to 2014
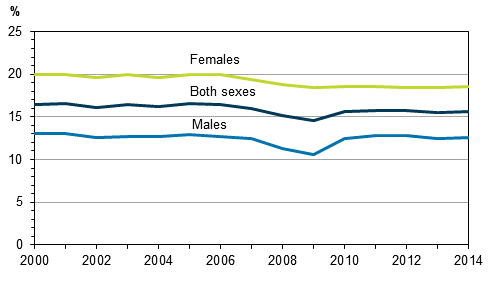
In 2014, sixteen per cent of employees aged 15 to 74 worked in temporary employment relationships. The share has remained almost at the same level since 2010, but compared to the early 2000s it has decreased slightly.
Temporary employment relationships are clearly more common for women than for men. In 2014, eighteen per cent of female employees worked in a temporary employment relationship and 13 per cent of male employees. (Figure 11.)
In Finland, the difference between sexes in the prevalence of temporary employment relationships has remained exceptionally high compared to other EU28 countries. Temporary employment relationships are more common for women in Finland than in EU28 countries on average but the share of men's temporary employment relationships is a little below the EU28 average.
Figure 11. Share of temporary employees of all employees aged 15 to 74 by sex in 2000 to 2014, %
Two out of three temporary employees would want a permanent job
The temporary nature of an employment relationship may be suitable for the life situation of the employee, a desired option, or be caused by that there is no permanent job available. In 2014, twenty-two per cent of fixed-term employees aged 15 to 64 did not want a permanent job. This was slightly fewer than in 2013 (24%).
The most common reason for working in a temporary employment relationship is that permanent work cannot be found. In 2014, there were on average 221,000 involuntary fixed-term employees, of which 138,000 were women and 82,000 were men. The lack of permanent jobs was the reason for working in a temporary employment relationship for 69 per cent of fixed-term employees. The share of involuntary temporary employment relationships grew slightly from 2013 when it was 67 per cent.
Involuntary temporary employment relationships were more common for women (71%) than for men (66%). Involuntary temporary employment relationships increase with age (Table 2).Table 2. Fixed-term employees by age and reason for temporary employment in 2014, %
| Age group | Total | Could not find permanent job | Did not want a permanent job | Other (probationary period, in education or training, DK) | |
| 15–64 | 100 | 68,7 | 22,3 | 8,2 | |
| 15–24 | 100 | 50,6 | 39,5 | 9,3 | |
| 25–34 | 100 | 75,9 | 14,8 | 8,6 | |
| 35–44 | 100 | 81,3 | 9,8 | 8,2 | |
| 45–54 | 100 | 80,9 | 10,6 | 7,2 | |
| 55–64 | 100 | 73,6 | 21,3 | . | |
Two per cent of temporary employees were in a probationary period and for around five per cent, the temporary employment relationship was related to work practice in 2014.
Temporary employment relationships among employees aged 15 to 74 were most common in other services (S-U) (30%), arts, entertainment and recreation activities (R) (29%), education (P) (25%), and health and social services (Q) (23%).
Around half of new employment contracts were temporary
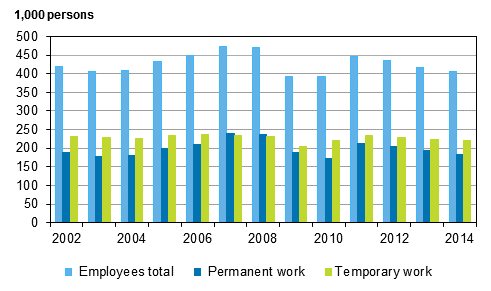
In 2014, the number of new employment contracts among employees aged 15 to 74 decreased. There were 406,000 employees whose employment relationship had lasted less than a year, which was 11,000 fewer than in 2013.
Good one-half of employment contracts among employees aged 15 to 64 that have lasted less than a year were temporary in 2014. 61 per cent of women's new employment relationships were temporary and 47 per cent of men's employment relationships. (Figure 12.)
Figure 12. Employees with employment contracts of under one year's duration in 2002 to 2014, persons aged 15 to 74
One per cent of employees did temporary agency work
Temporary agency work refers to an employment relationship in which an employee works via an enterprise which intermediates or hires labour force. The Labour Force Survey has collected data on temporary agency work since 2008. In 2014, the average number of persons doing temporary agency work was 29,000, or slightly more than in the year before. The shares of men and women doing temporary agency work is almost equal. The number of persons doing temporary agency work has remained around 27,000 to 29,000 persons from 2010 to 2014. This is around one per cent of all employees aged 15 to 74.
Around one-quarter of persons doing temporary agency work (7,000) work in wholesale and retail trade and close on one-fifth (6,000) in manufacturing. The next most persons doing temporary agency work can be found in accommodation and food service activities.
2.5 Part-time work increased especially among those aged over 65 and self-employed persons
Number of part-time employees highest in female-dominate industries
The number of part-time employed persons (employees and entrepreneurs) increased from 2013. In 2014, altogether 377,000 persons in the 15 to 74 age group worked part-time. This equals 15 per cent of all employed persons in the age group. The number was 8,000 higher than one year previously. The Labour Force Survey data on part-time employment is based on the respondents’ own reporting. The number of persons working part-time grew most in the 65 to 74 age group, by 7,000 persons from 2013.
The number of persons working part-time also grew by 7,000 persons in the 15 to 34 age group. Simultaneously, the number of persons working part-time decreased in the 35 to 64 age group.
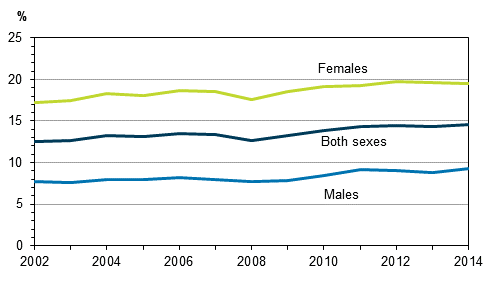
In 2014, the number of employees in part-time employment was 306,000, or 14 per cent of all employees aged 15 to 74. This was slightly more than in 2013. The share of part-time employees of all female employees was 19 per cent, and 9 per cent among male employees. The number of male employees working part-time grew by 4,000 persons compared with the previous year. (Figures 13 and 14)
Figure 13. Part-time employees aged 15 to 74 by sex in 2002 to 2014
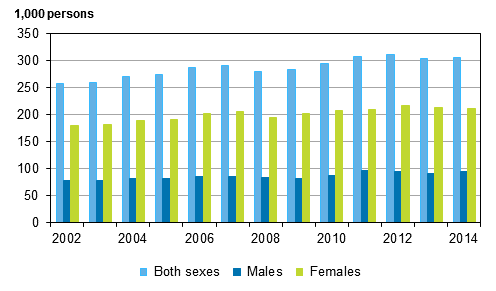
Figure 14. Share of part-time employees among employees aged 15 to 74 by sex in 2002 to 2014, %
Even though part-time work is more common for women than for men, it should be noted that Finnish women work relatively little in part-time employment compared to all EU28 countries. In EU28 countries, on average 33 per cent of employed women work part-time in 2013. For example, in Sweden, 39 per cent of employed women worked part-time in 2013.
In Finland, primarily young people and the aged work part-time. Forty-one per cent of young employees aged 15 to 24 worked part-time in 2014. Correspondingly, 16 per cent of employees aged 55 to 64 and 61 per cent of those aged 65 to 74 worked part-time.
Part-time employment among employees is more common in the private sector (16%) than in the public sector (11%). Relative to the employment of the entire industry, the share of part-time employees was highest in retail trade (excl. sale of motor vehicles) (38%) and in accommodation and food service activities (I), where 34 per cent of employees were working part-time.
Part-time work also became more common among entrepreneurs aged 15 to 74, up by 6,000 persons from 2013. The share of part-time workers in this group increased from 20 to 21 per cent. Especially part-time entrepreneurship of aged persons increased. In 2014, there were 72,000 part-time entrepreneurs aged 15 to 74. Good one-third of them (25,000) were aged over 65, which was 5,000 persons more than in 2013.
Lack of full-time work the reason for part-time employment more often than before
A majority of part-time employees work part-time due to reasons related to their life situation. Close on one-third (31%) of employees aged 15 to 64 working part-time reported studying as the reason for part-time work. Sixty-five per cent of young employees aged 15 to 24 worked part-time due to their studies.
Of all part-time employees aged 15 to 64, nine per cent reported caring for children or relatives as the reason for working part-time. This was most common for those aged 35 to 44, of whom 32 per cent reported this reason. Around one in ten (11%) worked part-time due to health-related reasons.
Nearly one in five (18%) of part-time employees aged 15 to 64 wanted to work part-time for some other reason. This was the reason for working part-time for two in five (41%) of part-time employees aged 55 to 64. Of employees aged over 65 working part-time, nearly all wanted to work part-time "for some other reason".
Close on one-third of part-time employees aged 15 to 64 worked part-time because they had not found full-time employment. The share has increased from 2013 so that in 2014, the lack of full-time work became as common a reason for working part-time as studying was. Involuntary part-time employment was most common in the 45 to 54 age group where one-half were working part-time because full-time work was not available. The share was also high in the 35 to 44 age group.
There were 90,000 involuntary part-time employees aged 15 to 64 in 2014, which was 7,000 persons more than in 2013. Of the part-time employees working part-time involuntarily, 66,000 were women and 25,000 were men.
Different forms of working among the employed
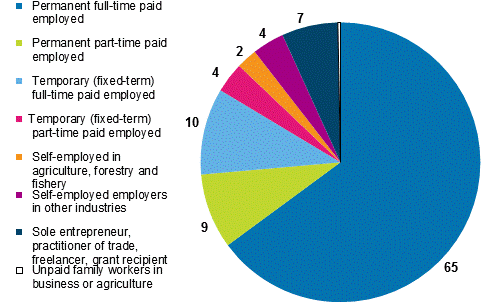
In Figure 15, the forms of working have been classified as precisely as is possible based on the data of the Labour Force Survey. The figure shows that full-time paid work based on an employment contract valid until further notice was still in 2014 the most common form of working in Finland among those aged 15 to 64. Nearly two-thirds (65%) of employed persons aged 15 to 64, i.e. 1,549,000 persons worked in this manner in 2014 Of them, 726,000 were women and 823,000 were men.
One in ten employed persons (238,000) were in full-time but fixed-term employment and four per cent (81,000 persons) had a part-time and fixed-term employment relationship. A little fewer than one in ten employed persons, i.e. 208,000 persons were working part-time as employees on an employment contract valid until further notice.
The share of persons working as sole entrepreneurs or like entrepreneurs, own-account workers, freelancers and grant recipients (excl. agriculture and forestry) among all employed persons aged 15 to 64 was six per cent in 2014. This corresponds to around 155,000 persons. Of all employed persons aged 15 to 64, four per cent were employer entrepreneurs (excl. agriculture and forestry) which equals 88,000 persons, and two per cent, or 57,000 persons were farmers and forestry entrepreneurs.Table 3. Different forms of working among persons aged 15 to 64 by sex in 2014, %
| Male | Female | |
| Permanent full-time paid employed | 68 | 62 |
| Permanent part-time paid employed | 5 | 12 |
| Temporary (fixed-term) full-time paid employed | 8 | 12 |
| Temporary (fixed-term) part-time paid employed | 2 | 5 |
| Self-employed in agriculture, forestry and fishery | 4 | 1 |
| Self-employed employers in other industries | 6 | 2 |
| Sole entrepreneur, practitioner of trade, freelancer, grant recipient | 7 | 5 |
| Unpaid family workers in business or agriculture | . | . |
Figure 15. Different forms of working among employed persons aged 15 to 64 in 2014, %
Source: Labour Force Survey 2014. Statistics Finland
Inquiries: Hanna Sutela 029 551 2907, Pertti Taskinen 029 551 2690, tyovoimatutkimus@stat.fi
Director in charge: Riitta Harala
Updated 28.4.2015
Official Statistics of Finland (OSF):
Labour force survey [e-publication].
ISSN=1798-7857. Employment and unemployment 2014,
2 Employment and unemployment in 2014
. Helsinki: Statistics Finland [referred: 6.1.2025].
Access method: http://www.stat.fi/til/tyti/2014/13/tyti_2014_13_2015-04-28_kat_002_en.html

