

Published: 2 November 2018
Educational qualifications highest among persons aged 40 to 44 in 2017
By the end of 2017, altogether 3,334,648 persons, or 72 per cent of the population aged 15 or over had completed a post-comprehensive level qualification. The share of persons with an educational qualification grew by one percentage point from the year before. Persons aged 40 to 44 had the highest level of education, as 87 per cent of them had completed a qualification.
Population by level of education, age and gender 2017
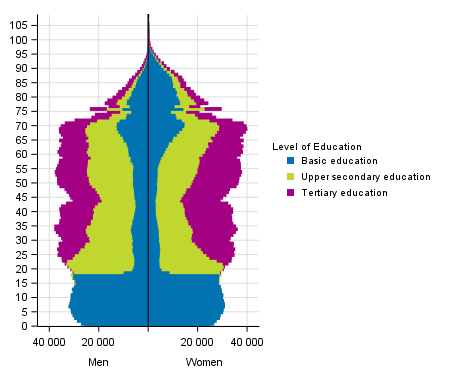
Thirty-one per cent of the population had completed a tertiary level qualification in 2017. Educational qualifications were highest among persons aged 40 to 44, of whom 47 per cent had attained a tertiary level qualification. The share of those with tertiary level qualifications does not rise as high in younger age groups. In the 35 to 39 age group, 44 per cent had completed a tertiary level qualification and in the 30 to 34 age group, 39 per cent. In other words, those aged 40 to 44 are for the time being the highest educated age group.
Men had completed more qualifications than women in the over 75 age group, in addition to which,the share of men in attainers of tertiary level qualifications was bigger in the 70 to 75 age group than that of women. Women aged under 70 were in the majority in both attainers of qualifications and in those with tertiary level qualifications. Thirty-five per cent of all women had completed tertiary level qualifications and 27 per cent of women had basic level qualifications. Overall, 27 per cent of men had completed tertiary level qualifications and 29 per cent were without a post-comprehensive level qualification. The differences between genders were even bigger in younger age groups. In women aged 25 to 34, tertiary level qualifications had been attained by 43 per cent and 13 per cent were without a post-comprehensive level qualification, while for men the corresponding shares were 28 and 19 per cent. Men were in the majority in upper secondary level education and just slightly in doctorate level education. Women thus complete the majority of tertiary level qualifications, but men entering tertiary level education complete more often a licentiate or doctorate level degree. The database tables describe the shares and numbers of those with qualifications examined by gender, age group and area.
Population by the measure of level of education based on length of education in 2017
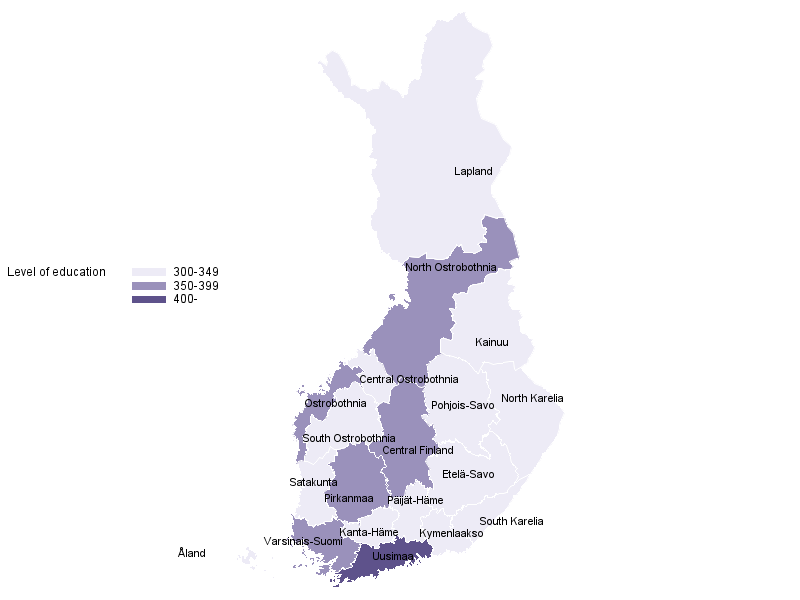
The highest educated population lived in Uusimaa in 2017. The population's measure of level of education indicates the average length of the highest level of completed education per capita. In Uusimaa, the population had completed an average of 4.1 years of post-comprehensive level education. The second highest educated population lived in Pirkanmaa, where the population had completed an average of 3.8 years of post-comprehensive level education. The exchange of Nordic qualification data improved the educational level of �land, when qualifications attained in other Nordic countries were added to Statistics Finland’s Register of Completed Education and Degrees. The population of �land had completed an average of 3.3 years of post-comprehensive level education, when before the exchange of data, those from �land had completed an average of 2.9 years of education.
In 2017, there were 111,748 persons aged 20 to 29 with only basic level education, making up 16 per cent of the age group. Among men, 18 per cent of the age group had only basic level education and 14 per cent among women. The number of persons aged 20 to 29 with only basic level education was highest in �land, where 23 per cent of the age group had no post-comprehensive level qualification. The share of persons with only basic level education was lowest in South Ostrobothnia and Kainuu, where 12 per cent of those aged 20 to 29 had no post-comprehensive level qualification.
Educational attainment of second level immigrants with foreign background by age 2017
| Age | Total | Basic education or less | Population with educational qualifications | Upper secondary /Post-secondary non tertiary education |
Tertiary education | |||||
| % | % | % | % | % | ||||||
| Total | 14 460 | 100,0 | 8 242 | 57,0 | 6 218 | 43,0 | 5 028 | 34,8 | 1 190 | 8,2 |
| 15-19 | 6 567 | 100,0 | 5 955 | 90,7 | 612 | 9,3 | 612 | 9,3 | . | . |
| 20-24 | 4 410 | 100,0 | 1 260 | 28,6 | 3 150 | 71,4 | 2 992 | 67,8 | 158 | 3,6 |
| 25-34 | 1 157 | 100,0 | 280 | 24,2 | 877 | 75,8 | 603 | 52,1 | 274 | 23,7 |
| 35-44 | 162 | 100,0 | 28 | 17,3 | 134 | 82,7 | 61 | 37,7 | 73 | 45,1 |
| 45-54 | 163 | 100,0 | 22 | 13,5 | 141 | 86,5 | 74 | 45,4 | 67 | 41,1 |
| 55-64 | 430 | 100,0 | 82 | 19,1 | 348 | 80,9 | 200 | 46,5 | 148 | 34,4 |
| 65-74 | 1 069 | 100,0 | 362 | 33,9 | 707 | 66,1 | 373 | 34,9 | 334 | 31,2 |
| 75- | 502 | 100,0 | 253 | 50,4 | 249 | 49,6 | 113 | 22,5 | 136 | 27,1 |
Second generation immigrants with foreign background, i.e. those born in Finland, are mainly young people. In all, 76 per cent of second generation immigrants with foreign background aged 15 or over belonged to the age group 15 to 24, whose studies were only beginning. Altogether 71 per cent of second generation immigrants with foreign background aged 20 to 24 had completed a qualification, which is 12 percentage points lower than the share of those with qualifications among the population in the same age group. Among second generation immigrants with foreign background, those aged 35 to 45 had the highest education, as 45 per cent of them had completed a tertiary level qualification.
Source: Education 2017. Statistics Finland
Inquiries: Mika Witting 029 551 3571, koulutustilastot@stat.fi
Director in charge: Jari Tarkoma
Publication in pdf-format (273.7 kB)
- Tables
-
Tables in databases
Pick the data you need into tables, view the data as graphs, or download the data for your use.
Appendix tables
Updated 2.11.2018
Official Statistics of Finland (OSF):
Educational structure of population [e-publication].
ISSN=2242-2919. 2017. Helsinki: Statistics Finland [referred: 15.6.2026].
Access method: http://stat.fi/til/vkour/2017/vkour_2017_2018-11-02_tie_001_en.html