

Published: 11 July 2014
Gross domestic product contracted by 1.2 per cent last year
Corrected on 30 September 2014 . The corrections are indicated in red.
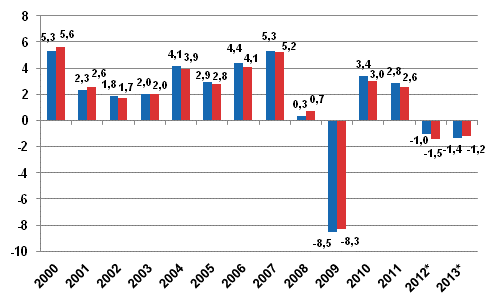
According to Statistics Finland’s revised preliminary data, the volume of Finland’s GDP contracted by 1.2 per cent in 2013. According to the initial preliminary data released in March, the decrease was 1.4 per cent. The GDP became revised as new data on intermediate consumption in manufacturing and other industries became available.
In 2012, the volume of GDP contracted by 1.5 per cent whereas previous estimates put the decline at one per cent. The revision was partly the result of decreased research and development expenditure.
National accounts have started using the new system of national accounts (ESA 2010) used in the European Union and new time series have been backcasted starting from the year 1975. The main changes made to time series are explained on the home pages of the statistics under " Changes in these statistics ".
Annual change in the volume of gross domestic product, per cent, in accordance with the old ESA95 national accounts (left column) and the new ESA2010 national accounts (right column)
Production contracted for the second year in a row last year and was at the 2006 level. The volume of value added decreased in nearly all main industries, for example, in manufacturing, construction, trade, transport, administrative and support service activities, financial and insurance activities, and administrative and support service activities. The volume of value added grew most in the manufacture of basic metals, the chemical industry and the forest industry.
Demand items in the national economy remained at previous year's level or declined. The volume of consumption expenditure remained unchanged. Private consumption expenditure decreased by 0.7 per cent but public consumption expenditure grew by 1.5 per cent. The transfer of the Finnish Broadcasting Company from non-financial corporations to the central government sector decreased private consumption expenditure and increased public consumption expenditure.
The volume of investments decreased by 4.8 per cent . Investments in nearly all types of goods decreased. Only investments in civil engineering constructions and transport equipment grew somewhat. The investment rate in accordance with the revised National Account, or the ratio of investments to gross domestic product was 21.2 per cent, the lowest since 1996.
The volume of exports shrunk by 1.7 per cent and that of imports by 2.5 per cent. The volume of goods exports and imports increased slightly but the imports and exports of services decreased clearly.
Non-financial corporations' operating surplus describing profits from their actual operations remained at previous year's level. The net saving of non-financial corporations diminished by EUR 1.4 billion from the previous year. Non-financial corporations’ net lending, or financial position, showed a surplus of EUR 4.3 billion. The financial position was improved by the fact that fixed investments in Finland diminished by 9 per cent last year.
The economy of general government showed a deficit of EUR 4.9 billion last year. The deficit amounted to 2.4 per cent of GDP.The deficit of central government was EUR 7 billion and that of municipalities and joint municipal boards amounted to EUR 1.6 billion. By contrast, the economy of employment pension schemes showed a surplus of EUR 3.8 billion.
General government's share of the gross value added that describes the size of the public economy was 21.2 per cent.
Households' disposable income declined by 0.6 per cent in real terms last year. Households' adjusted disposable income describing their economic well-being declined by 0.2 per cent in real terms last year.Adjusted income also includes welfare services produced by the public sector and organisations for households, such as educational, health and social services.
Households’ wage and salary income went up by 0.5 per cent and social benefits by 5.8 per cent. Households’ property and entrepreneurial income went up by 3.2 per cent.
National Accounts 2004 – 2013, Tables, PDF
Source: National Accounts, Statistics Finland
Inquiries: Olli Savela 029 551 3316, Tuomas Rothovius 029 551 3360, kansantalous@stat.fi
Director in charge: Leena Storg�rds
Publication in pdf-format (335.3 kB)
- Reviews
- Tables
-
Tables in databases
Pick the data you need into tables, view the data as graphs, or download the data for your use.
Appendix tables
Updated 11.7..2014
Official Statistics of Finland (OSF):
Annual national accounts [e-publication].
ISSN=1798-0623. 2013. Helsinki: Statistics Finland [referred: 15.5.2026].
Access method: http://stat.fi/til/vtp/2013/vtp_2013_2014-07-11_tie_001_en.html