

1. Finland’s net international investment position diminished in 2013
Finland started publishing the balance of payments and international investment position statistics in accordance with the new balance of payments and international investment position manual (BPM6) on 11 July 2014. The time series for the sub-items of the current account for the years 2006 to 2012 is not fully comparable with 2013 due to classification changes. In the financial account and international investment position, the new presentation according to statistical standards increases gross assets and liabilities. On the other hand the new recording methods have less impact on the net international investment position.
As part of the revision of the international statistical standards relating to the balance of payments statistics and the transfer of the balance of payments statistics from the Bank of Finland to Statistics Finland, it was decided to separate the statistics on foreign direct investments into specific statistics. The new annual statistics will be published for the first time on 31 October 2014 on Statistics Finland's website concerning the year 2013. Then data will be released on direct investments by country and industry according to the revised directional principle describing the investment relationship.
1.1 Financial account and international investment position
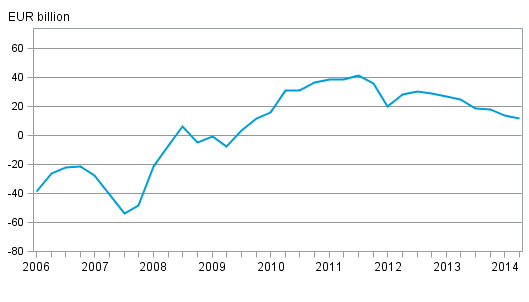
In 2013, inward capital flow on net to Finland was EUR 2.5 billion. At the end of the year, Finns' net international investment position 1) was EUR 17.7 billion, having been EUR 29.2 billion one year earlier. Exchange rate and other valuation changes lowered the net international investment position by EUR 9.0 billion. Foreign assets amounted to EUR 646.8 billion and liabilities to EUR 629.1 billion.
Figure 1: Net international investment position in 2006 to 2014, EUR billion
1.1.1 Financial account and international investment position by sector
At the end of the year, other monetary financial institutions (e.g. banks and other credit institutions) had EUR 239.9 billion in foreign assets and EUR 317.3 in liabilities. Net liabilities 2) mainly comprised of deposit liabilities, but also of liabilities connected to direct investments and securities. The central bank's net assets 3) fell to EUR 41.2 billion from the previous year's EUR 90.0 billion. The fall was due to a decrease in intra-Eurosystem assets.
Figure 2: Finland’s net international investment position by sector in 2006 to 2013, EUR billion
Net assets of other financial corporations (e.g. mutual funds) increased from the previous year's EUR 27,6 billion to EUR 35,0 billion. Investments of other financial corporations were mainly directed to securities.
Non-financial corporations' net foreign debt grew by EUR 6.3 billion during the year, being EUR 40.4 billion at the end of the year. Non-financial corporations had EUR 126.6 billion in foreign assets and EUR 167.0 billion in liabilities at the end of the year. Non-financial corporations' assets and liabilities mainly comprised of direct investments. Equity liabilities were also a large debt item.
In balance of payment terms, the central government's foreign gross debt amounted to EUR 93.6 billion at the end of 2013, having been EUR 97.5 billion one year earlier. The central government's foreign assets amounted to EUR 19.1 billion at the end of the year. Net assets of social security funds grew to EUR 100.8 billion from the previous year's EUR 93.5 billion, mainly due to the growth in foreign portfolio investments.
1.1.2 Finland’s outward portfolio investments
The value of Finland's outward portfolio investments was EUR 9.0 billion in 2013. EUR 4.8 billion were invested in foreign shares, which was EUR 2.6 billion more than in 2012. Shares in mutual funds registered abroad were purchased to the value of EUR 2.4 billion, which was less than in the year before. Investments in long-term bonds also contracted considerably compared to previous years, as the investment flow was EUR 3.5 billion in 2013.
Social security funds had the highest capital outflow and their investments in foreign securities grew by EUR 9.5 billion. Social security funds increased their foreign investments particularly in shares and bonds. Insurance corporations boosted their foreign investments by EUR 2.0 billion, most of which consisted of investments in bonds. Mutual funds registered in Finland invested EUR 3.0 billion in foreign securities, which was EUR 3.5 billion less than in the previous year. This was mainly caused by repatriation of investments made to foreign mutual fund shares.
Figure 3: Stocks of outward portfolio investments in 2013 by investor sector, EUR billion
The market value of Finland's outward portfolio investments was EUR 250.9 billion at the end of 2013. Price changes increased the market value of portfolio investments by EUR 8.8 billion during the year. Correspondingly, portfolio investments grew by EUR 13.6 billion in the previous year because of price changes.
Figure 4: Annual change of outward portfolio investment in 2006 to 2013, EUR billion
Altogether, EUR 5.0 billion were paid as profits related to outward portfolio investments. Dividend income from abroad to Finland amounted to EUR 1.6 billion, while one year before, the corresponding figure was EUR 1.2 billion. EUR 2.7 billion were paid as interest income from abroad to Finland. Compared to the previous year, interest income contracted by EUR 0.3 billion.
1.1.3 Inward portfolio investments
Portfolio investment liabilities grew by EUR 21.1 billion in 2013. EUR 14.4 billion of this are explained by foreign investors' investments in Finnish securities and the rest, EUR 6.7 billion, by the rise in the value of securities. Compared with 2012, the investment flow to Finland contracted.
In 2013, non-financial corporations' portfolio investment liabilities grew by EUR 19 billion from EUR 57 billion to EUR 76 billion. Foreign investors used EUR 2.6 billion to purchase Finnish non-financial corporations' shares. In 2012, inward investment in Finnish non-financial corporations' shares was EUR 0.4 billion on net, but before that, the last time more Finnish shares were purchased from abroad than sold was in 2007. During 2013, the value of Finnish non-financial corporations' shares also grew, which increased the investment stock. Foreign investors purchased bonds issued by Finnish financial institutions to the tune of over EUR 4 billion, which is slightly less than in 2012.
Figure 5: Finnish non-financial corporations’ portfolio investment liabilities, investment flows in 2006 to 2013, EUR billion
The majority of non-financial corporations' portfolio investment liabilities, 70 per cent, was foreigners' investments in shares. Foreign investments directed to non-financial corporations' bonds made up the remaining 30 per cent of the portfolio investment liabilities.
Figure 6: Finnish non-financial corporations’ portfolio investment liabilities, investment stocks in 2006 to 2013, EUR billion
In 2013, dividends paid to foreign investors on portfolio investments in Finland totalled EUR 2.1 billion, while one year before, dividends paid to foreign investors were EUR 0.3 billion higher. Interests paid to foreign investors amounted to EUR 4.2 billion, which is EUR 0.6 billion less than one year earlier.
1.1.4 Direct investments
In this publication, foreign direct investments are examined in gross amounts. This means that intra-group foreign liabilities and debts included in direct investments are not netted in any respect.
At the end of 2013, direct investment assets on gross stood at EUR 141.6 billion and corresponding liabilities at EUR 94.1 billion. During 2013, assets decreased by EUR 3.7 billion and liabilities by EUR 9.7 billion. The decline in the stock of direct investments is particularly visible in changes in intra-group loans and trade credits. In 2013, these debt assets decreased by EUR 4.4 billion and corresponding liabilities by EUR 7.1 billion.
Examined in gross, the stocks of direct investments grew strongly until 2010, after which they have developed more evenly. From 2006 to 2008, direct investment assets exceeded liabilities by around EUR 20 billion, after which this difference has doubled. When viewing only equity items, this growth in the net international investment position related to direct investments has been even stronger.
Figure 7: Direct investment assets and liabilities on gross in 2006 to 2013, EUR billion
In 2013 assets generated EUR 6.6 billion in profits for domestic investors and liabilities generated profits of EUR 3.4 billion for foreign investors. Relative to the gross assets and liabilities at the end of 2013, the returns on investment of assets were 4.6 per cent and corresponding returns on investment of liabilities 3.6 per cent. Profits received in 2010 to 2012 were, on average, 5.9 per cent and profits paid 4.9 per cent.
Figure 8: Profits received and paid on direct investments in 2006 to 2013, EUR billion
Primarily, the non-financial and financial corporations sectors have direct investments. The sector is determined based on the sector of the domestic party of the investment relationship. In 2013, the non-financial corporations sector accounted for 75 per cent of FDI liabilities and the financial sector for 24 per cent. In 2013, the non-financial corporations sector held the share of 84 per cent and the financial sector 13 per cent of FDI assets.
Figure 9: Direct investment assets on gross in 2013, (shares by sector)
1.1.5 Derivates and other investments
At the end of 2013, Finnish residents had EUR 82.1 billion in assets related to derivatives and EUR 77,7 billion in liabilities. Most of the assets and liabilities related to derivatives were held by banks. The recording of financial derivative flows has shifted from net recording to gross amount recording as a result of the statistics reform, which means that assets and debts are separated in the derivative flows. The gross amount recording increased the total flows related to financial assets and debts. The net amount item in the financial account is not affected by the change in the recording method.
Other investments in the financial account include loans, deposits and trade credits. At the end of 2013, deposit assets owned by the Finnish residents amounted to EUR 86.1 billion and liabilities to EUR 95.5 billion. Over the year, inward capital flow as deposits was EUR 4.5 billion. Loan assets amounted to EUR 62.7 billion and liabilities to EUR 82.6 billion.
Due to the statistical reform, a new item, other equity, was included in other investments. The new item consists of equity that is not in the form of securities and that comprises holdings in branches and in other units without a separate legal identity. Holdings in international organisations are also included in other equity. In addition, the counter item of the International Monetary Fund's (IMF) Special Drawing Rights (SDRs) is presented as a separate item on the liability side of the financial account's other investments.
Assets and liabilities on other investments diminished by the same amount, so in net amounts they cancelled each other out. Exchange rate and other valuation changes had more effect in total on the net value of other investments, and net liabilities grew from EUR 27.9 billion at the end of 2012 to EUR 29.0 billion by the end of 2013.
1.2 Current account
Classification changes were made to the current account for the year 2013, as a result of which the time series for the sub-items of the current account for the years 2006 to 2012 is not fully comparable with 2013.
In 2013, the current account showed a deficit of EUR 2.9 billion, while in 2012 it was EUR 3.9 billion in deficit. The deficit was particularly influenced by services and the secondary income account.
Figure 10: Current account by sub-item, net, in 2008 to 2013, EUR billion
1.2.1 Goods and services
In balance of payment terms, the trade account was mildly positive. The value of goods exports was EUR 55.6 billion and of imports EUR 55.5 billion. The level of goods exports has been revised from the national accounts release of July due to corrections made to classification items. As in previous years, the biggest export countries were Sweden, Russia and Germany. After Germany, most goods were exported to the Netherlands. When exports of services and goods are added up, the United States becomes the fourth biggest export country.
Figure 11: Finland’s exports to ten biggest destination countries in 2013, EUR billion
The services account showed a deficit of EUR 1.7 billion, when service exports stood at EUR 20.8 billion and service imports at EUR 22.4 billion. The main items of service exports were telecommunication, computer and information services, travel and other business services. The combined value of exports of these service items was EUR 10.0 billion. The biggest items in service imports were transportation, travel and other business services, in total EUR 15.4 billion. In these service sub-items, expenditure on travel continued to grow steadily and rose to EUR 4.0 billion. Most was spent on travelling to Spain and Estonia.
Figure 12: Expenditure on travel abroad in 2009 to 2013, EUR billion
1.2.2 Primary income and secondary income
Taxes and product fees that were previously recorded in current transfers are included in the primary income account according to the new balance of payments manual.
In 2013, the primary income account showed a surplus of EUR 1.2 billion. Inward investment income totalled EUR 11.8 billion and outward income EUR 10.9 billion. Investment income consists of interests, dividends and reinvested earnings.
1) Net investment position equals gross assets minus gross liabilities
2) Net liabilities equal liabilities minus assets
3) Net assets equal assets minus liabilities
Source: Balance of payments and international investment position, Statistics Finland
Inquiries: Mira Malhotra 029 551 3411, Tapio Kuusisto 029 551 3318, balanceofpayments@stat.fi.
Director in charge: Leena Storg�rds
Updated 24.9.2014
Official Statistics of Finland (OSF):
Balance of payments and international investment position [e-publication].
ISSN=2342-348X. 2013,
1. Finland’s net international investment position diminished in 2013
. Helsinki: Statistics Finland [referred: 17.6.2026].
Access method: http://stat.fi/til/mata/2013/mata_2013_2014-09-24_kat_001_en.html