Published: 25 January 2019
Number of new enterprises grew by 15 per cent in July to September 2018
According to Statistics Finland, the number of enterprise openings grew by 15.3 per cent in the third quarter of 2018 from the respective quarter of the year before. Examined by industry, the number of enterprise openings was highest in professional, scientific and technical activities. In the second quarter of 2018, enterprise closures were most numerous in the industry of trade.
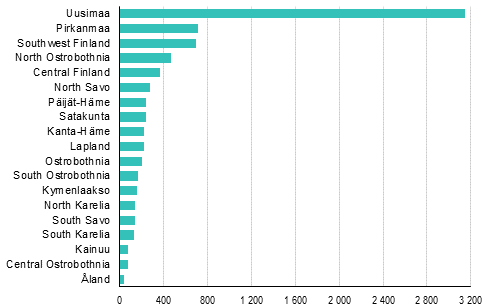
Enterprise openings by region, 3rd quarter of 2018

Enterprise openings, 3rd quarter of 2018
According to Statistics Finland, there were 7,965 enterprise openings in July to September 2018. The number of enterprise openings grew by 15.3 per cent compared to the third quarter of 2017, when they numbered 6,906. Enterprise openings accounted for 2.1 per cent of the total stock of enterprises in the third quarter of 2018.
Examined by industry, most enterprise openings were recorded in professional, scientific and technical activities, where they numbered 1,252. This is 15.7 per cent of all enterprise openings in the third quarter. In construction, enterprise openings numbered 1,017 (12.8%) and in trade 924 (11.6%).
Examined by region, most enterprise openings were recorded in Uusimaa: 3,149 enterprises. The number of enterprise openings was next highest in Pirkanmaa (714) and Southwest Finland (690). Relative to the enterprise stock, Uusimaa had the highest number of enterprise openings (2.6%).
Examined by sub-regional unit, the number of enterprise openings was highest in the sub-regional unit of Helsinki (2,994), followed by the sub-regional units of Tampere (594) and Turku (479). Relative to the enterprise stock, most enterprise openings were recorded in the sub-regional units of Helsinki, Jyväskylä and Oulu (2.6%) and in Riihimäki (2.5%).
Examined by municipality, the number of enterprise openings was highest in Helsinki (1,531), followed by Espoo (509), Vantaa (391), Tampere (375) and Turku (309).
Examined by legal form, enterprise openings in the form of natural persons numbered 4,437 and those in the form of limited companies 3,009 in the third quarter of 2018. Enterprise openings in the form of natural persons accounted for 55.7 per cent and those in the form of limited companies for 37.8 per cent of all enterprise openings.
Enterprise closures, 2nd quarter of 2018
According to Statistics Finland, there were 5,708 enterprise closures in April to June 2018. Enterprise closures accounted for 1.5 per cent of the total stock of enterprises in the second quarter of 2018.
Examined by industry, most enterprise closures were recorded in trade, numbering 1,011. This was 17.7 per cent of all enterprise closures in the second quarter. Enterprise closures numbered 968 (17%) in professional, scientific and technical activities and 733 (12.8%) in construction.
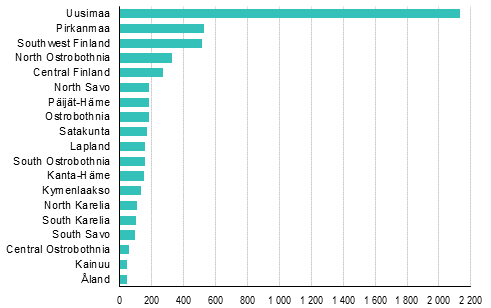
Among regions, most enterprise closures occurred in Uusimaa (2,129). The numbers of enterprise closures were next highest in Pirkanmaa (524) and Southwest Finland (512). Relative to the enterprise stock, Uusimaa had the highest number of enterprise closures (1.7%).
Examined by sub-regional unit, the number of enterprise closures was highest in the sub-regional unit of Helsinki (2,004), followed by the sub-regional units of Tampere (443) and Turku (339). Relative to the enterprise stock, the number of enterprise closures was highest in the sub-regional unit of Äänekoski (2.3%).
Examined by municipality, the highest numbers of enterprise closures were recorded in Helsinki (1,064), followed by Espoo (342), Tampere (288), Vantaa (223) and Turku (192).
Examined by legal form, in the second quarter of 2018, enterprise closures in the form of natural persons numbered 2,946 and those in the form of limited companies 2,175. Enterprise closures in the form of natural persons accounted for 51.6 per cent and those in the form of limited companies for 38.1 per cent of all enterprise closures.
Enterprise closures by region, 2nd quarter of 2018

Enterprise openings and closures are deduced from the Tax Administration's customer database. Changes in the Tax Administration's data systems or database maintenance can have an effect on the data of the statistics and comparability of time series.
Source: Enterprise openings 2018, 3rd quarter; enterprise closures 2018, 2nd quarter. Statistics Finland
Inquiries: Ritva Tikkanen 029 551 3300, Jyri Järvinen 029 551 3562, rakenne.tilastot@stat.fi
Director in charge: Mari Ylä-Jarkko
Publication in pdf-format (218.1 kB)
- Tables
-
Tables in databases
Pick the data you need into tables, view the data as graphs, or download the data for your use.
Appendix tables
Updated 25.01.2019
Official Statistics of Finland (OSF):
Enterprise openings and closures [e-publication].
ISSN=1799-2346. 3rd quarter 2018. Helsinki: Statistics Finland [referred: 13.2.2026].
Access method: http://stat.fi/til/aly/2018/03/aly_2018_03_2019-01-25_tie_001_en.html

