Published: 5 April 2019
A total of 2,468 candidates in Parliamentary elections 2019
Corrected on 30 October 2019. The corrections are indicated in red.
Altogether 2,468 candidates were nominated for the 2019 Parliamentary elections, which is 322 more than in the previous Parliamentary elections. Of the candidates, 990 are municipal councillors and 165 Members of Parliament in the present Parliament. A total of 19 registered political parties take part in the Parliamentary elections. Four more parties participate in the elections than in the previous Parliamentary elections. More detailed data on the candidates can be found in the review: Background analysis of candidates in the Parliamentary elections 2019.
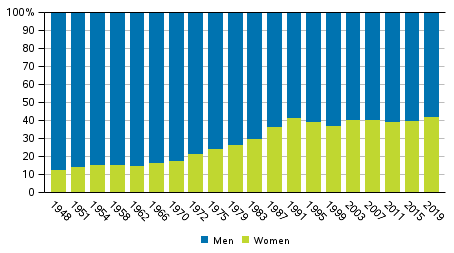
Men and women as percentage of candidates in Parliamentary elections 1948 to 2019 (%)

Of all candidates, 70.0 per cent were nominated by the parties elected to the present Parliament (National Coalition Party, Finnish Social Democratic Party, Finns Party, Centre Party of Finland, Swedish People's Party in Finland, Green League, Christian Democrats in Finland) and by the Blue Reform. Of the parties from which no MPs were elected to the present Parliament, the most candidates were nominated by the Seven Star Movement (175 candidates) and least by the Animal Justice Party of Finland (17 candidates). A total of 136 candidates outside any party were nominated in the entire country. The parties that got candidates elected into parliament in the 2015 Parliamentary elections are called "parliamentary parties". This also includes the Blue Reform.
A majority of the candidates in the Parliamentary elections have always been men. In the Parliamentary elections 2019, altogether 1,432 of the candidates are men and 1,036 women. Women's proportion of candidates is thus 42.0 per cent, which is 2.6 percentage points higher than in the 2015 Parliamentary elections.
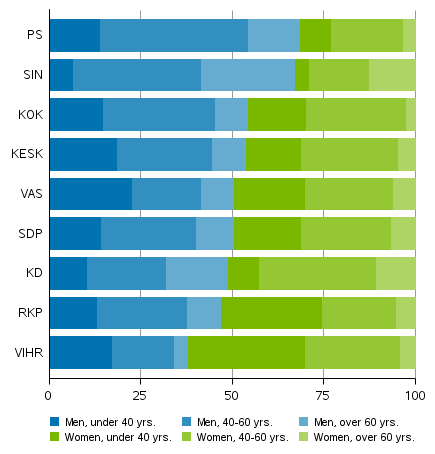
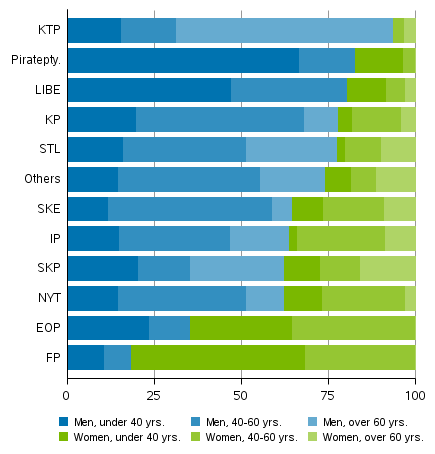
Of the parliamentary party candidates, the proportion of women candidates is smallest for the Finns Party (31.5 per cent) and biggest for the Green League (62.0 per cent). Among all parties, the proportion of female candidates is highest in the Feminist Party (81.6 per cent) and lowest in the Communist Worker's Party (6.3 per cent). Men account for 53.1 per cent of all parliamentary parties’ candidates. In parties and constituency associations from which no MPs were elected to the present Parliament, men's share of candidates is 69.5 per cent.
Share of men and women among candidates by party and age in Parliamentary elections 2019, parliamentary parties (%)

The average age of all candidates is 46.9 years, that of male candidates is 47.9 and that of female ones 45.5. Of all candidates, 1,675 are aged 40 or over. Of the candidates, 31 are aged 75 or over and 137 are aged 25 or younger.
Share of men and women among candidates by party and age in Parliamentary elections 2019, other parties and constituency associations (%)

Among the parliamentary parties, the Swedish People's Party has the most candidates aged under 25 (12.2 per cent) and the Finns Party have least (0.9 per cent). The share of the Swedish People's Party candidates aged under 25 is also biggest among all parties. In relative terms, the Blue Reform has the most candidates aged 65 or over (19.7 per cent) and the Green League has least (3.7 per cent). The age of the candidate is the age on the election day.
Table 1. Background analysis of candidates by party in the Parliamentary elections 2019
| Party | Memb. of Parl. (%) | Counc. in municipal councils (%) | Average age | Finn. or Sami speakers (%) | Swedish speakers (%) | Other lang. speakers (%) | Employed (%) | Unemployed (%) | In inactive pop. (%) | Avg. income |
| Total | 6.7 | 40.1 | 46.9 | 91.2 | 6.0 | 2.3 | 72.9 | 8.9 | 18.2 | 29,111 |
| KESK | 17.1 | 58.8 | 45.7 | 95.4 | 1.9 | 2.8 | 90.3 | 1.9 | 7.9 | 39,345 |
| PS | 8.0 | 62.4 | 48.1 | 98.1 | 0.9 | 0.5 | 83.6 | 6.1 | 10.3 | 30,257 |
| KOK | 17.1 | 72.5 | 45.4 | 97.2 | 1.4 | 1.4 | 91.5 | 0.9 | 7.6 | 47,476 |
| SDP | 13.4 | 71.8 | 45.6 | 93.5 | 2.8 | 3.7 | 88.9 | 4.2 | 6.9 | 35,888 |
| VIHR | 5.1 | 60.6 | 41.3 | 94.0 | 2.3 | 3.7 | 86.1 | 5.6 | 8.3 | 30,406 |
| VAS | 4.6 | 51.4 | 44.3 | 93.5 | 2.8 | 3.7 | 77.8 | 13.0 | 9.3 | 27,866 |
| RKP | 7.1 | 46.9 | 44.0 | 7.1 | 91.8 | 1.0 | 83.7 | 1.0 | 15.3 | 36,956 |
| KD | 2.6 | 38.4 | 51.3 | 94.7 | 3.7 | 1.1 | 78.4 | 7.4 | 14.2 | 31,119 |
| SKP | - | 1.1 | 53.0 | 92.0 | 1.1 | 5.7 | 40.9 | 11.4 | 47.7 | 19,208 |
| KTP | - | - | 58.1 | 90.6 | 3.1 | 6.3 | 15.6 | 12.5 | 71.9 | 16,101 |
| LIBE | - | 2.8 | 37.6 | 88.9 | 5.6 | - | 66.7 | 2.8 | 30.6 | 24,809 |
| Piratepty. | - | 2.3 | 35.0 | 94.3 | 3.4 | 2.3 | 55.2 | 20.7 | 24.1 | 19,376 |
| EOP | - | - | 40.0 | 94.1 | 5.9 | - | 64.7 | 23.5 | 11.8 | 15,222 |
| KP | - | 8.0 | 48.6 | 98.0 | - | 2.0 | 64.0 | 14.0 | 22.0 | 18,182 |
| FP | - | 2.6 | 36.7 | 89.5 | 2.6 | 2.6 | 55.3 | 18.4 | 26.3 | 23,249 |
| IP | - | 4.3 | 50.6 | 95.7 | 4.3 | - | 36.2 | 29.8 | 34.0 | 20,674 |
| SIN | 6.6 | 20.4 | 54.4 | 96.1 | 1.3 | 2.6 | 59.9 | 11.2 | 28.9 | 26,308 |
| SKE | - | - | 47.9 | 100.0 | - | - | 26.5 | 23.5 | 50.0 | 16,034 |
| STL | 0.6 | 3.4 | 53.5 | 94.3 | 1.1 | 1.7 | 40.6 | 17.7 | 41.7 | 19,334 |
| NYT | 0.9 | 8.3 | 47.1 | 93.6 | 4.6 | 0.9 | 72.5 | 10.1 | 17.4 | 29,650 |
| Others | 3.7 | 14.8 | 50.4 | 77.8 | 18.5 | 3.7 | 44.4 | 14.8 | 40.7 | 21,408 |
Of all candidates in the Parliamentary elections, 990 are municipal councillors, which is 40.1 per cent of all candidates. The share of municipal councillors among candidates is biggest for the Coalition Party, 72.5 per cent of candidates, in absolute numbers the Social Democratic Party has most municipal councillors as candidates, 155. Altogether, 165 of the candidates are Members of Parliament, which is 6.7 per cent of all candidates.
Of all candidates, 91.2 per cent are Finnish or Sami speakers, 6.0 per cent Swedish speakers and 2.3 per cent speak other than national languages as their native language.
Based on main type of activity, 72.9 per cent of all Parliamentary election candidates are employed, 8.9 per cent are unemployed and 18.2 per cent are in the inactive population. Of the parliamentary parties, the Coalition Party has the most employed persons in relative terms among the candidates, 91.5 per cent and the Blue Reform the least, 59.9 per cent. Of the parliamentary parties, the Blue Reform (28.9%) has in relative terms the most candidates in the inactive population and the Finnish Social Democratic Party the least (6.9%). The inactive population includes students, pensioners and those in military or non-military service.
The median for the disposable monetary income of all candidates is EUR 29,111 per year. Measured by the median, the candidates nominated by the Coalition Party have the highest income, over EUR 47,000. Of the parliamentary parties, the candidates of the Blue Reform have the lowest income, around EUR 26,000.
The data are based on Statistics Finland's statistics on the nomination of candidates for the Parliamentary elections 2019. The national register of candidates is published on the Internet pages of the Ministry of Justice (www.vaalit.fi/en/).
Source: Parliamentary Elections 2019, nomination of candidates. Statistics Finland
Inquiries: Sami Fredriksson 029 551 2696, Kaija Ruotsalainen 029 551 3599, vaalit@stat.fi
Director in charge: Jari Tarkoma
Publication in pdf-format (703.0 kB)
- Reviews
- Tables
-
Tables in databases
Pick the data you need into tables, view the data as graphs, or download the data for your use.
Appendix tables
- Quality descriptions
-
- Parliamentary elections, quality description (5.4.2019)
Updated 5.4.2019
Official Statistics of Finland (OSF):
Parliamentary elections [e-publication].
ISSN=1799-6279. Nomination of candidates and background analysis of candidates 2019. Helsinki: Statistics Finland [referred: 4.2.2026].
Access method: http://stat.fi/til/evaa/2019/01/evaa_2019_01_2019-04-05_tie_001_en.html

