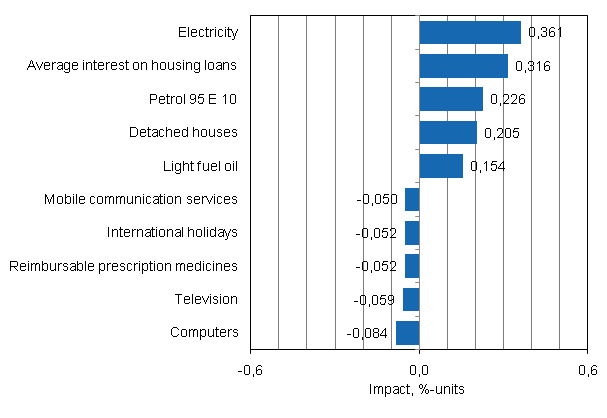
Appendix figure 2. Goods and services with the largest impact on the year-on-year change in the Consumer Price Index, September 2011

Source: Consumer Price Index, Statistics Finland
Inquiries: Juhani Pekkarinen (09) 1734 3476, Mari Ylä-Jarkko (09) 1734 3310, khi@stat.fi
Director in charge: Kari Molnar
Updated 14.10.2011
Official Statistics of Finland (OSF):
Consumer price index [e-publication].
ISSN=1799-0254. September 2011,
Appendix figure 2. Goods and services with the largest impact on the year-on-year change in the Consumer Price Index, September 2011
. Helsinki: Statistics Finland [referred: 6.2.2026].
Access method: http://stat.fi/til/khi/2011/09/khi_2011_09_2011-10-14_kuv_002_en.html

