Published: 24 October 2008
Consumption of hard coal decreased by 36 per cent in January to September
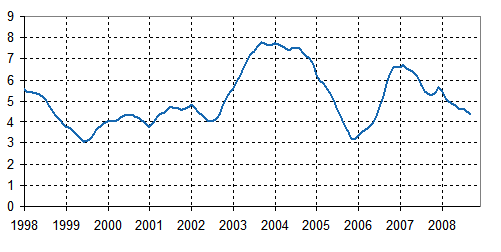
Approximately 2.3 million tonnes (56,000 TJ) of hard coal was consumed as fuel in the generation of electricity and heat in the January to September period of 2008. The consumption fell by 36 per cent from the corresponding period of the previous year and was 40 per cent below the average for the 2000s. Use of hard coal decreased both in separate production of electricity and in combined heat and power production. The reasons for the decrease in consumption were the favourable water situation in the Nordic countries and ample production of hydro power as well as the beginning of the second EU emissions trading period at the start of the year. The need for heating energy was reduced by the mild weather in January and February.
The depletion of the water supply in the Nordic countries which started in August-September showed as an increase in the use of hard coal in the latest quarter. At the same time, Finland's exports of electricity grew larger than imports on the Nordic electricity market. Nevertheless, 28 per cent less hard coal was still consumed in the third quarter than in the corresponding period of the year before.
Consumption of Hard Coal, 12-month moving total, million tonnes

Consumption of Hard Coal, 1000 t
| 2001 | 2002 | 2003 | 2004 | 2005 | 2006 | 2007 | 2008 | |
| January | 490 | 580 | 820 | 890 | 380 | 550 | 560 | 410 |
| February | 600 | 440 | 750 | 720 | 430 | 590 | 680 | 330 |
| March | 640 | 420 | 730 | 660 | 570 | 660 | 510 | 330 |
| April | 430 | 320 | 660 | 550 | 280 | 420 | 340 | 230 |
| May | 340 | 190 | 570 | 490 | 230 | 370 | 240 | 150 |
| June | 260 | 130 | 380 | 460 | 90 | 450 | 300 | 170 |
| July | 190 | 210 | 380 | 410 | 50 | 500 | 110 | 90 |
| August | 210 | 270 | 490 | 480 | 90 | 580 | 300 | 200 |
| September | 230 | 450 | 650 | 430 | 90 | 680 | 500 | 370 |
| October | 330 | 760 | 700 | 530 | 210 | 660 | 640 | |
| November | 420 | 770 | 700 | 630 | 300 | 660 | 750 | |
| December | 570 | 800 | 800 | 480 | 460 | 450 | 720 | |
| 1st to 3rd quarter total | 3390 | 3020 | 5430 | 5080 | 2230 | 4810 | 3530 | 2270 |
| Whole year | 4710 | 5360 | 7640 | 6720 | 3200 | 6590 | 5640 | |
Hard Coal Stocks, month-end, million tonnes
| 2006 | 2007 | 2008 | |
| January | 5.0 | 4.4 | 3.6 |
| February | 4.6 | 4.1 | 3.6 |
| March | 4.1 | 4.2 | 3.7 |
| April | 3.9 | 4.4 | 3.7 |
| May | 3.8 | 4.8 | 3.9 |
| June | 3.7 | 4.8 | 4.0 |
| July | 3.4 | 4.9 | 4.1 |
| August | 3.2 | 5.0 | 4.3 |
| September | 3.3 | 4.7 | 4.1 |
| October | 3.5 | 4.5 | |
| November | 3.8 | 4.1 | |
| December | 4.4 | 3.7 |
Source: Since 2005 Statistics Finland, 1997-2004 Coal Users' Committee/Finergy
Inquiries: Mr Anssi Vuorio +358 9 1734 2685, Ms Leena Timonen +358 9 1734 2518, energia@stat.fi
Acting Director in charge: Mr Matti Parkkinen
- Tables
-
Tables in databases
Pick the data you need into tables, view the data as graphs, or download the data for your use.
Last updated 24.10.2008
Official Statistics of Finland (OSF):
Consumption of hard coal [e-publication].
ISSN=1798-2588. September 2008. Helsinki: Statistics Finland [referred: 23.2.2026].
Access method: http://stat.fi/til/kivih/2008/09/kivih_2008_09_2008-10-24_tie_001_en.html

