

Published: 30 September 2016
Current account in deficit in 2015, net international investment position positive
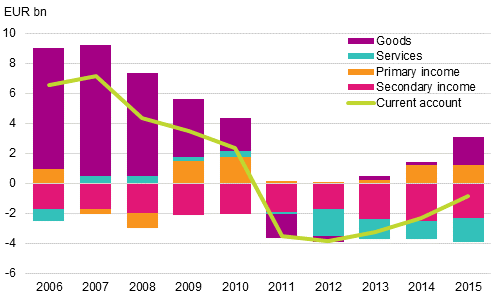
The current account deficit contracted to EUR 0.9 billion in 2015. The trade account strengthened notably, because the decline in goods imports was faster than the fall in goods exports. The deficit of the service account grew as service imports grew faster than service exports. During 2015, net capital inflow to Finland was EUR 2.0 billion. The net international investment position was EUR 1.3 billion positive at the end of the year. The data appear from Statistics Finland's statistics on balance of payments and international investment position.
Current account balances 2006–2015, EUR billion
Current account
The current account deficit contracted to EUR 0.9 billion in 2015. In 2014, the deficit amounted to EUR 2.3 billion. The decrease in the current account deficit was caused by the growth in the surplus of the trade account to EUR 1.9 billion (EUR 0.2 billion in 2014). Goods imports went down by 5.7 per cent to EUR 52.8 billion and goods exports by 2.7 per cent to EUR 54.7 billion. This faster decline in goods imports than in goods exports strengthened the trade account. From the peak year of exports, 2008, the value of goods exports in balance of payments terms has fallen by 16 per cent and the value of goods imports in balance of payments terms by ten per cent.
The services account was EUR 1.6 billion in deficit as exports of services amounted to EUR 22.5 billion and imports to EUR 24.1 billion. Service exports grew by 4.4 per cent while service imports grew by 5.9 per cent.
Of the other sub-items of the current account, the primary income account was EUR 1.2 billion in surplus and the secondary income account EUR 2.3 billion in deficit.
Financial account and international investment position
Net capital inflow to Finland was EUR 2.0 billion, that is, the investment flow from abroad to Finland was greater than investments from Finland to abroad. Finland's net international investment position was EUR 1.3 billion at the end of the year, having been EUR -5.4 billion one year earlier. At the same time, the fall in the net international investment position that started in 2010 ended. Changes in prices increased Finland's net investment position by EUR 5.0 billion.
Portfolio investments
The net flow of outward investments directed to foreign securities, that is, the difference between purchases and sales totalled EUR -0.6 billion. Investments in foreign shares decreased by EUR 1.3 billion. Portfolio investment liabilities grew in total by EUR 6.4 billion.
Direct investments
The fall in gross direct investment assets in 2013 to 2014 halted. In turn, liabilities grew to the highest level in history at the end of 2015. As a result of the stronger growth in liabilities than in assets, net assets connected to direct investments nearly halved to EUR 11.2 billion compared to EUR 20.3 billion in the year before.
Source: Balance of payments and international investment position, Statistics Finland
Inquiries: Tapio Kuusisto 029 551 3318, Saana Ranta-Ruona 029 551 3375, balanceofpayments@stat.fi.
Director in charge: Ville Vertanen
Publication in pdf-format (410.1 kB)
- Reviews
- Tables
-
Tables in databases
Pick the data you need into tables, view the data as graphs, or download the data for your use.
Appendix tables
- Revisions in these statistics
-
- Revisions in these statistics (30.9.2016)
Updated 30.9.2016
Official Statistics of Finland (OSF):
Balance of payments and international investment position [e-publication].
ISSN=2342-348X. 2015. Helsinki: Statistics Finland [referred: 26.7.2026].
Access method: http://stat.fi/til/mata/2015/mata_2015_2016-09-30_tie_001_en.html