Published: 21 December 2017
Current account in surplus, net international investment position was negative
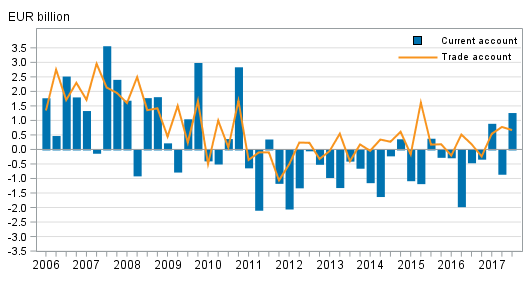
The current account turned EUR 1.3 billion into surplus in the third quarter of 2017. Exports of both goods and services grew more than imports and the trade account in balance of payments terms was in surplus. The primary income account also increased the surplus. In other words, more investment income, such as interests and dividends, was paid to Finland than abroad from Finland. The net international investment position was negative. The data appear from Statistics Finland's statistics on balance of payments and international investment position.
Current account and trade account

Current account
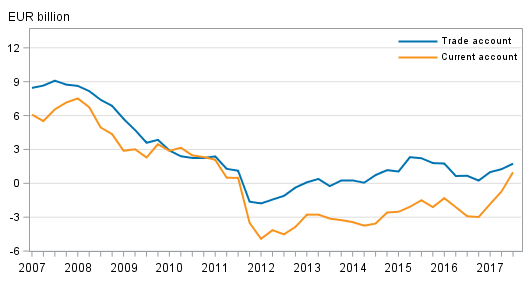
The current account was EUR 1.3 billion in surplus in the third quarter of 2017. This was explained by both the positive primary income account and the trade account being in surplus. In addition, the deficit of the service account contracted. The 12-month moving total of the current account started to show a surplus, which was particularly due to the primary income account being in surplus.
Goods and services
In balance of payment terms, the trade account was EUR 0.7 billion in surplus. In the corresponding quarter of the previous year, the trade account was EUR 0.2 billion in surplus. The service account’s deficit contracted to EUR 0.2 billion. In the third quarter of 2016, the deficit stood at EUR 0.7 billion.
In the third quarter, goods exports in balance of payments terms amounted to EUR 14.4 billion and grew by 10 per cent from the corresponding period in 2016. Goods imports increased to EUR 13.7 billion, rising by seven per cent year-on-year. In January to September, goods exports in balance of payments terms grew by 14 per cent.
Service exports, EUR 6.3 billion, grew by eight per cent and service imports, EUR 6.5 billion, remained on level with the previous year. In January to September, service exports increased by eight per cent.
The value added of factoryless goods production previously included in exports of manufacturing services has been included in the statistics as goods exports starting from the statistical reference year 2014. The change was made in March 2017. A corresponding change to earlier years will be made in connection with the next time series correction. As a result of the change, the level of service exports before 2014 falls and the level of goods exports rises. The correction will not change the combined value of exports of goods and services.
Import and export figures in balance of payments terms by service item and area can be found in the statistics on international trade in goods and services . Adjustments made to the Finnish Customs figures, which result in goods trade in balance of payments terms, are also broken down in the statistics on international trade in goods and services.
Primary income and secondary income
The primary income account was EUR 1.3 billion in surplus in the third quarter. The primary income account comprises compensation of employees, investment income and other primary income paid abroad from Finland and from abroad to Finland. The surplus of primary income is mainly due to investment income, which includes returns on capital like interests and dividends. EUR 1.1 billion were paid in investment income to Finland in net. In January to September, the surplus of the primary income account was EUR 1.7 billion.
The deficit on secondary income account was EUR 0.4 billion in the third quarter.
Finland’s current account and trade account, 12 –month moving sum

Financial account and net international investment position
Net international investment position was negative
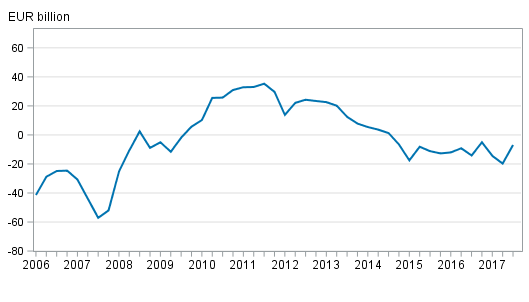
At the end of the third quarter of 2017, Finland had EUR 627.1 billion in foreign assets on gross and EUR 634.0 billion in foreign liabilities on gross. The net international investment position was thus EUR 6.9 billion negative. The net investment position strengthened compared with the end of the previous quarter, when the net investment position was EUR -19.7 billion. Both foreign assets and liabilities increased in the third quarter. Capital flowed out from assets to the tune of EUR 7.3 billion, but other valuation changes, that is, changes in exchange rates, prices and other changes, increased the stock of assets by EUR 21.8 billion. EUR 9.4 billion of liabilities were decreased, but for liabilities other valuation changes also increased the stock by EUR 11.0 billion.
Examined by sector, the net international investment position improved in the third quarter of 2017 most due to the improved net investment position of the non-financial corporations sector from EUR -76.5 billion to EUR -69.7 billion and that of the central bank sector from EUR 70.5 billion to EUR 83.4 billion. Social security funds had the biggest net foreign assets, EUR 132.0 billion, while the other financial institutions sector held the largest net foreign liabilities, EUR 159.5 billion.
Finland’s net international investment position quarterly

Capital flowed from Finland as direct investments and portfolio investments
In the third quarter of 2017, net capital outflow from Finland amounted to EUR 2.1 billion, which improved the net international investment position. Examined by type functional category, capital flowed from Finland on net as direct investments and portfolio investments. Inward capital flow was mostly in the form of other investments, that is, for example, as loans from outside the group, deposits and trade credits, EUR 7.1 billion on net.
At the end of the third quarter of 2017, international direct investment assets on gross stood at EUR 159.6 billion and the corresponding liabilities at EUR 113.1 billion. The net investment position of direct investments was thus positive at the end of the third quarter as there were EUR 46.5 billion more assets than liabilities. The net investment position of direct investments strengthened in the third quarter, when assets from foreign direct investments grew more than liabilities.
In the third quarter, assets from foreign direct investments made abroad from Finland increased by EUR 3.4 billion and, in addition, other valuation changes related to assets increased gross assets by EUR 0.4 billion. Liabilities from direct investments increased by EUR 1.3 billion on net and the increase in liabilities was directed primarily at equity items.
The net international position of portfolio investments improved in the third quarter of 2017 as assets from portfolio investments grew and the stock of liabilities fell. Portfolio investment assets amounted to EUR 305.3 billion and portfolio investment liabilities to EUR 317 billion at the end of the third quarter. The increase in portfolio investment assets was primarily caused by the growth in equity and investment fund shares in the third quarter, when assets in these items totalled EUR 172.5 billion. Portfolio investment liabilities contracted in the third quarter, because foreign portfolio investments in bonds and money market instruments decreased by EUR 3.6 billion and in equity and investment fund shares by EUR 2.1 billion. The liabilities stock of portfolio investments also decreased due to valuation changes in bonds.
At the end of the third quarter of 2017, Finland had EUR 0.3 billion in derivative-related net assets, which is EUR 2.0 billion less than at the end of the second quarter. Both derivative-related assets and liabilities have declined considerably compared to one year ago mainly as a result of international company restructurings. Assets have contracted from EUR 102.5 billion to EUR 20.3 billion and liabilities from EUR 98.6 billion to EUR 20.0 billion.
Source: Balance of payments and international investment position, Statistics Finland
Inquiries: Tapio Kuusisto 029 551 3318, Pauliina Turunen 029 551 2958, balanceofpayments@stat.fi.
Director in charge: Ville Vertanen
Publication in pdf-format (316.1 kB)
- Tables
-
Tables in databases
Pick the data you need into tables, view the data as graphs, or download the data for your use.
Appendix tables
Updated 21.12.2017
Official Statistics of Finland (OSF):
Balance of payments and international investment position [e-publication].
ISSN=2342-348X. 3rd quarter 2017. Helsinki: Statistics Finland [referred: 10.2.2026].
Access method: http://stat.fi/til/mata/2017/43/mata_2017_43_2017-12-21_tie_001_en.html

