

Published: 15 June 2018
Current account in surplus in the first quarter, net international investment position weakened
The current account was in surplus in the first quarter of 2018. In balance of payments terms, goods exports grew by 5 per cent and service exports by 2 per cent. The net exports of goods and services turned to a slight deficit as imports grew faster than exports. The surplus of investment income increased the current account surplus. The net international investment position weakened. The data appear from Statistics Finland's statistics on balance of payments and international investment position.
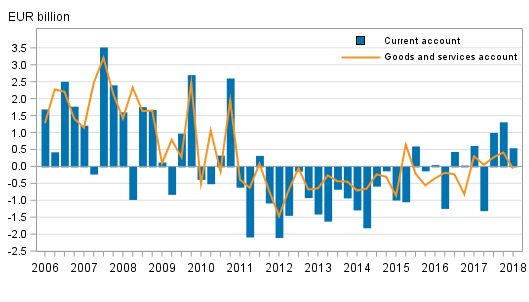
Current account and goods and services account
Current account
In the first quarter of 2018, the current account was EUR 0.5 billion in surplus. The net exports of goods and services turned to a slight deficit as imports grew faster than exports and the primary income account was in surplus.
Goods and services
The trade account in balance of payments terms was EUR 0.3 billion in surplus in the first quarter of 2018. In the corresponding quarter of the previous year, the trade account surplus amounted to EUR 0.5 billion. The service account showed a deficit of EUR 0.4 billion in the first quarter of 2018. The service account weakened particularly due to the decrease in exports of telecommunications, computer and information services compared to the corresponding quarter last year.
Goods exports in balance of payments terms amounted EUR 15.4 billion in the first quarter of 2018, which means that goods exports strengthened by 5 per cent from the corresponding period of 2017. Goods imports rose to EUR 15.1 billion, rising by 7 per cent year-on-year.
In the first quarter of 2018, service exports grew by 2 per cent and service imports by 5 per cent compared to the corresponding quarter of the previous year. Service exports rose to EUR 6.4 billion and service imports to EUR 6.8 billion and thus the service account again showed a deficit.
Import and export figures in balance of payments terms by service item and area can be found in the statistics on international trade in goods and services starting from 2015. Decreases and increases made to the Finnish Customs figures, which result in goods trade in balance of payments terms, are also broken down in the statistics on international trade in goods and services.
Primary income and secondary income
The primary income account was EUR 1.2 billion in surplus in the first quarter of 2018. The primary income account includes compensation of employees, investment income and other primary income paid abroad from Finland and from abroad to Finland. The surplus of primary income was mainly due to investment income, which includes i.a. returns on capital like interests and dividends. EUR 1.0 billion were paid in investment income in net to Finland in the first quarter of 2018.
The secondary income account was EUR 0.6 billion in deficit in the first quarter of 2018.
Current account in deficit in April 2018
The current account was EUR 0.9 billion in deficit in April. The value of goods exports in balance of payments terms grew by 19 per cent from twelve months back. According to the Finnish Customs data , the value of exports was raised by a ship delivery of EUR 0.5 billion to Germany. Of the sub-items of the current account, the trade account in balance of payment terms was in surplus. The service account, the primary income account and the secondary income account were in deficit.
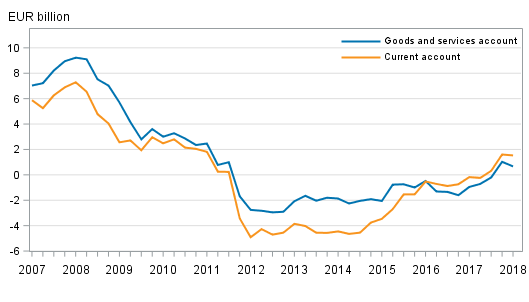
Finland’s current account and goods and services account, 12 –month moving sum
Financial account and net international investment position
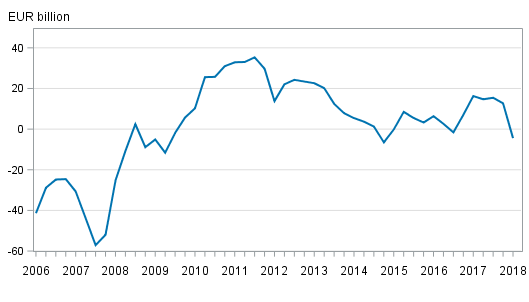
Net international investment position negative
At the end of the first quarter of 2018, Finland had EUR 623.9 billion in foreign assets on gross and EUR 628.3 billion in foreign liabilities on gross. The net international investment position, that is, the difference between the stock of assets and liabilities, was thus negative at the end of the first quarter as there were EUR 4.4 billion more liabilities than assets. The net investment position contracted compared to the end of the previous quarter, when the net international investment position was EUR 12.7 billion. Both foreign assets and liabilities increased in the first quarter, but liabilities grew more than assets. Finnish foreign investments decreased with EUR 13.3 billion and liabilities reduced EUR 9.2 billion.
Examined by sector, the net international investment position weakened in the first quarter of 2018 most due to the weakened net investment position of the other monetary financial institutions sector from EUR -125.7 billion to EUR -151.5 billion and that of the non-financial corporations sector from EUR -62.2 billion to EUR -71.8 billion. Employment pension schemes had the biggest foreign net assets, EUR 139.5 billion, while the other monetary financial institutions sector held the largest foreign net liabilities.
Finland’s net international investment position quarterly
Capital flowed to Finland as portfolio investments
In the first quarter of 2018, net capital inflow to Finland amounted to EUR 4.1 billion, which weakened the net international investment position. Examined by type of investment, net capital inflow was mostly in the form of portfolio investments, EUR 3.3 billion. Of the sub-items of the financial account, capital outflow was only in the form of other investments, that is, for example, as loans from outside the group, deposits and trade credits, EUR 0.2 billion on net.
At the end of the first quarter of 2018, international direct investment assets on gross stood at EUR 155.8 billion and the corresponding liabilities at EUR 114.7 billion. The net investment position of direct investments was thus positive at the end of the first quarter as there were EUR 41.0 billion more assets than liabilities. The net investment position of direct investments weakened in the first quarter, when foreign direct investment liabilities grew more than assets. Finland's assets from foreign direct investments increased in the first quarter on net by EUR 3.6 billion, but valuation changes related to assets decreased gross assets in the first quarter by EUR 2.6 billion. Liabilities from direct investments increased by EUR 3.8 billion on net and valuation changes related to liabilities decreased gross liabilities by EUR 1.8 billion in the first quarter.
The net international position of portfolio investments weakened in the first quarter of 2018 as assets from portfolio investments decreased and the stock of liabilities grew. Portfolio investment assets amounted to EUR 313.5 billion and portfolio investment liabilities to EUR 321.6 billion at the end of the first quarter of 2018. In the first quarter, assets decreased due to valuation changes, because portfolio investment assets in the form of financial transactions increased. Portfolio investment assets diminished in shares and money market instruments. In turn, assets from mutual fund shares and bonds increased in the first quarter, whereby the asset stock of mutual fund shares was EUR 124.4 billion and that of bonds EUR 127.8 billion. The liabilities stock of securities grew from the previous quarter, which was mainly due to valuation changes in shares and net investments. At the end of the first quarter, the liabilities stock of shares totalled EUR 103.1 billion. Bond liabilities also grew and were EUR 178.4 billion at the end of the first quarter. The liabilities stock of mutual fund shares decreased and was EUR 24.7 billion at the end of the first quarter.
In the first quarter, financial transactions increased Finnish other investments abroad, e.g. loans from outside the corporate group, deposits and trade credits by EUR 4.2 billion on net. Capital was also increased in other investments to the tune of EUR 4.0 billion on net. At the end of the first quarter, other investment assets amounted to EUR 125.8 billion and liabilities to EUR 171.6 billion.
At the end of first quarter of 2018, Finland had EUR 0.2 billion in net liabilities related to derivatives. Liabilities related to derivatives grew from the previous quarter, being EUR 20.4 billion at the end of the first quarter of 2018. Finland had EUR 20.2 billion in assets related to derivatives at the end of the first quarter of 2018.
Financial account in April 2018
In April, net capital inflow to Finland amounted to EUR 1.1 billion. Of the sub-items of the financial account, net capital outflow was mostly in the form of other investments, EUR 1.1 billion. Net capital inflow was mostly in the form of portfolio investments, EUR 1.8 billion.
Source: Balance of payments and international investment position, Statistics Finland
Inquiries: Pauliina Turunen 029 551 2958, Tapio Kuusisto 029 551 3318, balanceofpayments@stat.fi.
Director in charge: Ville Vertanen
Publication in pdf-format (310.1 kB)
- Tables
-
Tables in databases
Pick the data you need into tables, view the data as graphs, or download the data for your use.
Appendix tables
Updated 15.06.2018
Official Statistics of Finland (OSF):
Balance of payments and international investment position [e-publication].
ISSN=2342-348X. April 2018. Helsinki: Statistics Finland [referred: 27.7.2026].
Access method: http://stat.fi/til/mata/2018/04/mata_2018_04_2018-06-15_tie_001_en.html