Published: 20 May 2009
Record immigration and migration gain in 2008
According to Statistics Finland, 29,100 persons immigrated to Finland from foreign countries during 2008. The number is 3,100 higher than in the previous year and the highest during Finnish independence. Emigration from Finland increased slightly and was 13,650 persons. During 2008, net immigration totalled 15,450 persons, which is the highest number in the post-war period. In the last quarter of 2008, net immigration totalled 400 persons more than in the same quarter of the year before.
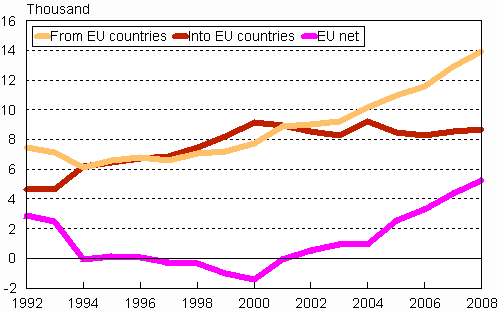
During the past eight years immigration into Finland from other EU countries has been higher than emigration from Finland to other EU countries. In 2008, Finland had a migration gain of 5,200 persons from EU countries. Immigration into Finland from other EU countries has been growing continuously since 1997. Emigration from Finland into other EU countries has remained stable during the past few years.
Migration between Finland and other EU countries 1992–2008

The number of intermunicipal migrations was 269,800 in 2008, which is 10,350 lower than in the previous year. Migrations decreased by 11,700 inside regions and increased by 1,300 between regions. When looking at migration inside the country, the region of Uusimaa had the largest migration gain (2,800 persons) and the region of Pirkanmaa the second largest gain (1,600 persons). As in the previous year, Kanta-Häme had the largest migration gain relative to the size of the population. Population losses from migration inside the country were largest in the regions of Kymenlaakso (1,000) and Lapland (850). The migration losses of Kainuu and Kymenlaakso were the largest relative to the size of the population. In 2008, intramunicipal migrations numbered 560,300, which is 27,850 (5%) fewer than in 2007.
Migration 1987–2008
| Year | Type | ||||
| Intermunicipal in-migration | Intramunicipal migration | Immigration | Emigration | Net migration | |
| 1987 | 184,577 | 497,274 | 9,142 | 8,475 | 667 |
| 1988 | 195,743 | 458,585 | 9,720 | 8,447 | 1,273 |
| 1989 | 191,627 | 406,945 | 11,219 | 7,374 | 3,845 |
| 1990 | 178,280 | 388,294 | 13,558 | 6,477 | 7,081 |
| 1991 | 167,482 | 403,321 | 19,001 | 5,984 | 13,017 |
| 1992 | 160,876 | 439,825 | 14,554 | 6,055 | 8,499 |
| 1993 | 165,637 | 477,092 | 14,795 | 6,405 | 8,390 |
| 1994 | 200,876 | 478,195 | 11,611 | 8,672 | 2,939 |
| 1995 | 199,398 | 502,215 | 12,222 | 8,957 | 3,265 |
| 1996 | 217,901 | 541,422 | 13,294 | 10,587 | 2,707 |
| 1997 | 222,939 | 538,444 | 13,564 | 9,854 | 3,710 |
| 1998 | 239,118 | 573,525 | 14,192 | 10,817 | 3,375 |
| 1999 | 242,590 | 564,124 | 14,744 | 11,966 | 2,778 |
| 2000 | 244,133 | 543,591 | 16,895 | 14,311 | 2,584 |
| 2001 | 265,176 | 593,422 | 18,955 | 13,153 | 5,802 |
| 2002 | 257,469 | 576,801 | 18,113 | 12,891 | 5,222 |
| 2003 | 256,624 | 592,467 | 17,838 | 12,083 | 5,755 |
| 2004 | 266,347 | 598,304 | 20,333 | 13,656 | 6,677 |
| 2005 | 275,886 | 616,083 | 21,355 | 12,369 | 8,986 |
| 2006 | 273,538 | 592,028 | 22,451 | 12,107 | 10,344 |
| 2007 | 280,156 | 588,114 | 26,029 | 12,443 | 13,586 |
| 2008 | 269,792 | 560,281 | 29,114 | 13,657 | 15,457 |
- The regional division in all years is the one valid on 1 January 2009.
Source: Population and Cause of Death Statistics. Statistics Finland
Inquiries: Matti Saari (09) 1734 3401, vaesto.tilasto@stat.fi
Director in charge: Jari Tarkoma
Publication in pdf-format (257.5 kB)
- Tables
-
Tables in databases
Pick the data you need into tables, view the data as graphs, or download the data for your use.
- Figures
- Quality descriptions
-
- Quality description, migration (20.5.2009)
Updated 20.5.2009
Official Statistics of Finland (OSF):
Migration [e-publication].
ISSN=1797-6782. 2008. Helsinki: Statistics Finland [referred: 10.2.2026].
Access method: http://stat.fi/til/muutl/2008/muutl_2008_2009-05-20_tie_001_en.html

