Published: 4 November 2015
Food industry had the highest relative employment impacts in manufacturing in 2010 and 2011
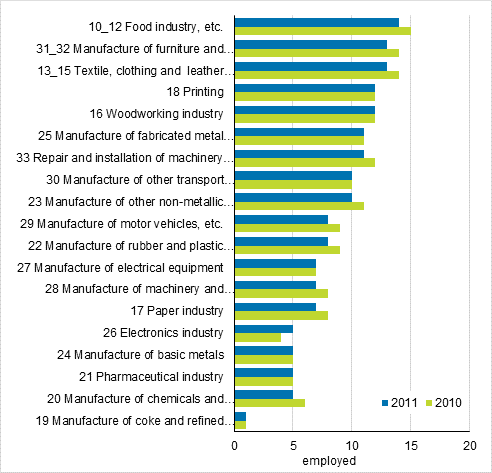
According to Statistics Finland's input-output statistics, industry 10_12 Food industry, etc. had the highest relative total impacts of all manufacturing industries on employment in Finland's national economy in 2010 and 2011. According to the labour input coefficients, the total impact of an increase of EUR one million in the final use (final consumption expenditure + gross capital formation + exports) of the products of the industry on the number of employed persons in Finland's national economy was 15 employed persons in 2010 and 14 employed persons in 2011. The employment impacts were the next highest in 13_15 Textile, clothing and leather industries and in 31_32 Manufacture of furniture and other products.
Total impact of an increase of EUR one million in final use on the number of employed persons in manufacturing industries (TOL C) in 2010 to 2011

The total impact on the number of employed persons is comprised of direct impact and indirect impact. Direct impact is the direct impact of an increase of EUR one million in the final use demand of the product on the industry's employment. In indirect impacts, account is taken of the multiplier impacts of an increase of EUR one million of the final use demand through inputs bought from other industries on the production and employment of other industries.
Statistics Finland publishes annually the supply and use tables describing product flows in the national economy, and the input-output and analysis tables derived from them. The data published now concern the years 2010 and 2011 following the new European System of Accounts (ESA 2010). Tables concerning the year 2012 (ESA 2010) were published in December 2014. Data for 2000 to 2009 will not be published according to the new European System of Accounts. Tables concerning the year 2013 (ESA 2010) will be published in February 2016.
Source: Input-output 2010 and 2011, Statistics Finland.
Inquiries: Markku Räty 029 551 2647, Tuomas Rothovius 029 551 3360, kansantalous@stat.fi
Director in charge: Ville Vertanen
Publication in pdf-format (165.6 kB)
- Tables
-
Tables in databases
Pick the data you need into tables, view the data as graphs, or download the data for your use.
Updated 4.11.2015
Official Statistics of Finland (OSF):
Input-output [e-publication].
ISSN=1799-201X. 2011. Helsinki: Statistics Finland [referred: 18.2.2026].
Access method: http://stat.fi/til/pt/2011/pt_2011_2015-11-04_tie_002_en.html

