This set of statistics has been discontinued.
Statistical data on this topic are published in connection with another set of statistics.
Data published after 5 April 2022 can be found on the renewed website.
Published: 10 June 2010
Surplus of international trade in services fell in 2009
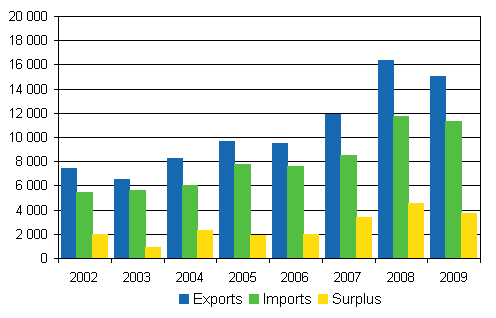
According to Statistics Finland’s preliminary data, the surplus of international trade in services contracted to EUR 3.7 billion in 2009, which is over 18 per cent less than in 2008. Services were exported in 2009 to the tune of around EUR 15 billion, while imports of services amounted to about EUR 11.4 billion.
Imports, exports and surplus of foreign trade in services 2002–2009, mill. euro

The surplus of international trade contracted as exports of services decreased more than imports did. The value of exports fell in 2009 by over seven per cent, which is over EUR 1.2 billion relative to 2008. In contrast, imports of services fell by slightly over 3.5 per cent, a total of EUR 418 million. As in 2008, exports and imports still stayed on the high level, which was particularly visible in trade of IT services.
The surplus of international trade in services grew in royalty and licence fees. Exports of these services increased by over EUR 200 million, while imports fell by around EUR 480 million. In 2008 the deficit of international trade in royalties and licence fees was EUR 373 million, whereas in 2009 the surplus was EUR 317 million.
In exports of services the key trade partners were India, Sweden and China. In addition to Sweden, of the neighbouring countries most services were exported to Russia and Germany. Imports of services are centred on certain countries more clearly than exports are. The key importing countries of services are still Germany, the United States, the United Kingdom and Sweden.
The EU15 share of service exports still remained on the low level compared with the early years of the statistics. China and India increased their share of international trade in services in 2009. The significance of these countries as trading partners has grown from 2002.
The statistics on international trade in services are based on the annual and quarterly Statistics Finland survey on the international trade in services. The data include service trade between group enterprises. The statistics do not include transportation, travel, insurance and financial services.
Source: Foreign trade in services 2009, preliminary results, Statistics Finland
Inquiries: Jaakko Salmela (09) 1734 2953, Marjatta Tenhunen (09) 1734 2927, globalisaatio.tilastot@stat.fi
Director in charge: Leena Storgårds
Publication in pdf-format (238.3 kB)
- Tables
-
Tables in databases
Pick the data you need into tables, view the data as graphs, or download the data for your use.
Appendix tables
Updated 10.6.2010
Statistics:
International trade in services [e-publication].
ISSN=1798-3525. 2009. Helsinki: Statistics Finland [referred: 23.2.2026].
Access method: http://stat.fi/til/pul/2009/pul_2009_2010-06-10_tie_001_en.html

