Published: 10 February 2012
Confirmed election result: Sauli Niinistö was elected President 2012
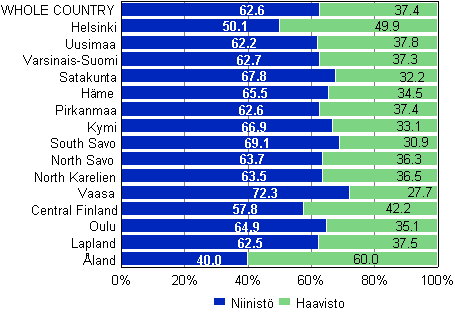
In the second round of the Presidential election Sauli Niinistö clearly defeated his rival candidate Pekka Haavisto. The total number of votes cast for Niinistö was 1,802,328, which is 62.6 per cent of all votes cast. Pekka Haavisto, the runner-up, received 1,077,425 votes, that is, 37.4 per cent of all votes cast. Sauli Niinistö received 724,903 more votes than Pekka Haavisto in the second round of the elections. Compared with the first round of the election, the number of votes cast for Niinistö grew by 671,074 votes (by 25.6 percentage points) and that for Haavisto by 503,150 votes (by 18.6 percentage points). The data are based on Statistics Finland's statistics on the confirmed election result from the second round of the Presidential election 2012.
Support for the presidential candidates by constituency in Presidential election 2012, second round

Niinistö beat Haavisto in the second round of the Presidential election in all constituencies of Mainland Finland, only in the constituency of Åland Haavisto got more votes than Niinistö. The support for Niinistö was highest in the constituency of Vaasa, where he received 72.3 per cent of all votes. In the constituency of Helsinki Niinistö defeated Haavisto by a narrow margin, gaining 50.1 per cent of the votes cast: the difference between the support for the candidates was only 739 votes. In Mainland Finland only in the municipality of Kolari in the constituency of Lapland the support for Niinistö remained lower than that for Haavisto, being 44.9 per cent of votes cast. The support for Niinistö was highest in the municipality of Soini in the constituency of Vaasa, where he received 86.0 per cent of all votes cast. In addition to Helsinki, the support for Niinistö was also lower than average in Jyväskylä (52.7%), Turku (54.9%), Oulu (57.5%) and Tampere (57.7%).
Voting turnout fell distinctly in the second round of the Presidential election
In the second round the voting turnout of Finnish citizens resident in Finland remained at 68.9 per cent, which was 3.9 per cent lower than in the first round two weeks ago. Compared with the second round of the 2006 election, the voting turnout went down by 8.3 percentage points. Voting turnout in Presidential elections has last been lower than this in the elector college elections in 1950. The voting turnout fell in the second round particularly on the actual election day. In the second round of the Presidential election the number of advance voters was higher than the number of voters on the actual election day.
Voting was the most active in the constituency of Helsinki, where the voting turnout was 74.8 per cent. The voting turnout also rose over 70 per cent in the constituencies of Uusimaa (73.2%), Varsinais-Suomi (71.0%) and Pirkanmaa (70.6%). After the constituency of Åland (55.8%), the voting turnout was lowest in the constituencies of Lapland (62.0%), North Karelia (62.4%) and North Savo (63.0%). Of municipalities in Mainland Finland voting was the most active in Kauniainen, in the constituency of Uusimaa, where the voting turnout was 85.8 per cent and the least active in Hyrynsalmi in the constituency of Oulu, where the voting turnout was only 48.6 per cent.
Compared with the first round of the Presidential election,
voting turnout declined in all constituencies. The voting turnout
went down most in the constituencies of Lapland
(-9.6 percentage points) and Oulu
(-6.6 percentage points). The voting turnout fell least
in the constituencies of Åland (-0.6 percentage points)
and Helsinki (-1.8 percentage points).
Voting turnout of Finnish citizens living in Finland in Presidential election 2012, second and first round
| Constituency | 2nd round 2012 |
1st round 2012 |
| Whole country | 68.9 | 72.8 |
| Helsinki | 74.8 | 76.6 |
| Uusimaa | 73.2 | 75.6 |
| Varsinais-Suomi | 71.0 | 73.6 |
| Satakunta | 67.4 | 71.9 |
| Häme | 68.8 | 71.8 |
| Pirkanmaa | 70.6 | 73.6 |
| Kymi | 66.7 | 70.7 |
| South Savo | 65.4 | 69.4 |
| North Savo | 63.0 | 68.9 |
| North Karelia | 62.4 | 67.0 |
| Vaasa | 67.4 | 73.4 |
| Central Finland | 66.4 | 71.8 |
| Oulu | 64.4 | 71.0 |
| Lapland | 62.0 | 71.6 |
| Åland | 55.8 | 56.4 |
Statistics Finland's free-of-charge election result services
Statistics Finland's election map service provides data illustrated by maps and charts on the Presidential election 2012. Maps and bar charts can be used to examine such as voting turnout and its changes from the previous Presidential elections, candidates with most votes and shares of votes in different area levels. Maps are available by municipality, constituency and in the largest towns by voting district.
More detailed election result data are available as database tables by constituency, municipality and voting district. The database can be used for building diverse sets of tables and convert data to other file formats for further processing.
Source: Presidential Elections 2012, second round, Statistics Finland
Inquiries: Kimmo Moisio 09 1734 3239, Jaana Asikainen 09 1734 3506, vaalit@stat.fi
Director in charge: Jari Tarkoma
Publication in pdf-format (317.1 kB)
- Tables
-
Tables in databases
Pick the data you need into tables, view the data as graphs, or download the data for your use.
Appendix tables
- Quality descriptions
-
- Presidential elections, quality description (10.2.2012)
Updated 10.2.2012
Official Statistics of Finland (OSF):
Presidential elections [e-publication].
ISSN=2242-3699. confirmed election result, second round 2012. Helsinki: Statistics Finland [referred: 2.2.2026].
Access method: http://stat.fi/til/pvaa/2012/02/pvaa_2012_02_2012-02-10_tie_001_en.html

