Published: 6 March 2012
Most recent graduates found employment more easily than one year before in 2010
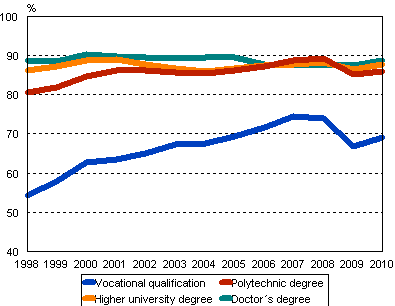
According to Statistics Finland, the majority of recent graduates found employment more easily in 2010 than one year earlier. The employment of graduates with upper secondary vocational qualifications improved by two percentage points. Sixty-nine per cent of them were employed. Employment was found by 86 per cent of those with polytechnic degrees, by 88 per cent of those with higher university degrees, such as master's degrees, and by 89 per cent of those with doctor's degrees. Of them one percentage point more were employed than one year before. Employment of recent graduates has improved or remained unchanged during good ten years despite the weakening of employment in 2009.
Employment of graduates one year after graduation 1998–2010, %

Employment among recent graduates is measured one year after their graduation. Employment of all recent graduates was on level with the year before, at 68 per cent. Only those with lower university degrees had more difficulties in finding employment than one year previously. Sixty-eight per cent of them were employed. Of all recent graduates, 17 per cent were studying while working and 15 per cent were full-time students; this was so for 39 per cent of the passers of the matriculation examination and for 31 per cent of those with lower university degrees.
The proportion of the unemployed decreased by one percentage point. The proportion of the unemployed was eight per cent. At 13 per cent, the proportion of the unemployed was the highest among attainers of upper secondary vocational qualifications. Six per cent of the graduates from polytechnics and five per cent of the graduates with higher university degrees were unemployed.
Men's transition to working life improved and women's remained unchanged. However, women found employment more easily than men did. The proportion of employed women was over ten percentage points higher than that of men. Of all recent graduates, 61 per cent of men and 73 per cent of women were working. The rate of employment was 63 per cent for men and 75 per cent for women among attainers of upper secondary vocational qualifications. Eighty-four per cent of men and 87 per cent of women with polytechnic degrees were employed. Eighty-nine per cent of men and 87 per cent of women with higher university degrees had found jobs.
There were differences in the transition to working life by field of education. Finding employment was most difficult for those graduating from the field of culture. Their employment rate was 64 per cent. The transition was smoothest for attainers of qualifications in the fields of safety and security, welfare, health and sport. Their employment rate was over 88 per cent. In all fields of education the transition was easier for those with university degrees than for those with upper secondary qualifications. At 18 per cent, the rate of unemployment was highest for those with upper secondary qualifications in the field of culture.
Examined by region, the rate of employment varied from 79 per cent in Åland to 59 per cent in North Karelia. Besides Åland, the rate of employment was higher than the average for the whole country in the regions of Uusimaa, Varsinais-Suomi, Kanta-Häme, Varsinais-Suomi, Ostrobothnia and Central Ostrobothnia.
Source: Education 2012. Statistics Finland
Inquiries: Ritva Kaukonen 09 1734 3311, koulutustilastot@stat.fi
Director in charge: Jari Tarkoma
Publication in pdf-format (238.3 kB)
- Tables
-
Tables in databases
Pick the data you need into tables, view the data as graphs, or download the data for your use.
Appendix tables
- Figures
Updated 6.3.2012
Official Statistics of Finland (OSF):
Transition from school to further education and work [e-publication].
ISSN=1798-9469. 2010. Helsinki: Statistics Finland [referred: 5.2.2026].
Access method: http://stat.fi/til/sijk/2010/sijk_2010_2012-03-06_tie_001_en.html

