This set of statistics has been discontinued.
New data are no longer produced from the statistics.
Published: 16 April 2015
The net operating profit of investment firms was 127 million in 2014
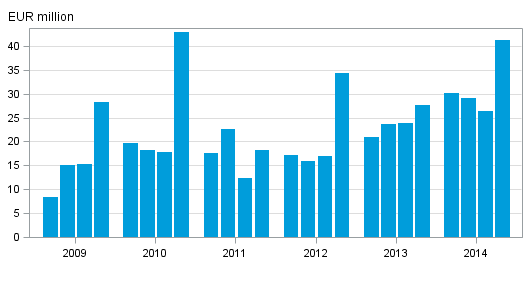
The net operating profit of investment firms amounted to EUR 127 million in 2014. The operating profit grew by EUR 31 million compared to 2013. These data derive from Statistics Finland’s statistics on investment firms.
Investment firms' net operating profit by quarter

Commission income and expenses
Investment firms accrued a total of EUR 361 million in commission income, which is EUR 60 million more than in 2013. Commission expenses amounted to EUR 86 million, which is EUR 11 million more than one year previously.
Interest income and expenses
Interest income amounted to EUR 1.1 million, which is 27 per cent less than one year earlier and EUR 141 million more than in the previous quarter. Interest expenses increased by 11 per cent from the previous year.
Administrative and operating expenses
The largest expenditure item of investment firms was administrative expenses, which over the year 2014 amounted to EUR 148 million, which was 11 per cent more than in the previous year. Of the administrative expenses, personnel expenses amounted to EUR 88 million, or 60 per cent of total administrative expenses. Other operating expenses were EUR 22 million and they grew by EUR five million from the previous year.
Balance sheets
The aggregate value of the balance sheets was EUR 293 million. The balance sheets grew by 16.3 per cent year-on-year. The share of own equity in the total of the balance sheets was 65.2 per cent.
At the end of 2014, there were 57 investment firms operating in Finland of which 42 generated a positive operating result.
Source: Investment firms, Statistics Finland
Inquiries: Jan Klavus 029 551 3391, Hilkka Jaatinen 029 551 3630
Director in charge: Mari Ylä-Jarkko
Publication in pdf-format (248.4 kB)
- Tables
-
Tables in databases
Pick the data you need into tables, view the data as graphs, or download the data for your use.
Appendix tables
- Appendix table 1. Profit and loss accounts of investment firms 1.1.- 31.12.2014, EUR thousands (16.4.2015)
- Appendix table 2. Balance sheet of investment firms 1.1.- 31.12.2014, EUR thousands (16.4.2015)
- Appendix table 3. Itemisation of investment firms administrative expenses 1.1.- 31.12.2014, EUR thousands (16.4.2015)
- Figures
Updated 16.04.2015
Official Statistics of Finland (OSF):
Investment service companies [e-publication].
ISSN=2342-5202. 4th quarter 2014. Helsinki: Statistics Finland [referred: 16.2.2026].
Access method: http://stat.fi/til/spy/2014/04/spy_2014_04_2015-04-16_tie_001_en.html

