Published: 14 April 2016
Fall in the number of births accelerated
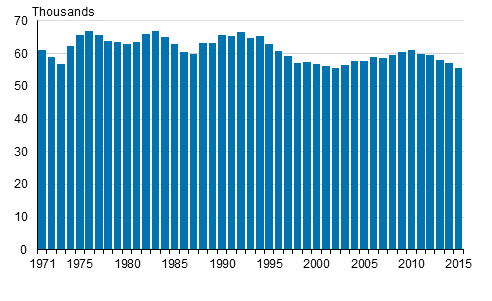
According to Statistics Finland's data on population changes, the fall in the number of births accelerated compared to the year before. In 2015, altogether 55,472 children were born, which was 1,760 fewer than in the year before. The decrease in the number nearly doubled from 2014. The number of births was last lower than in 2015 in the year of exception 1868, when slightly under 44,000 children were born. However, the number of births in 2002 was almost the same as in 2015, only 83 more.
Live births 1971–2015

The number of births has now decreased for the fifth year in succession. At the birth rate prevailing in 2015, a woman would give birth to an average of 1.65 children, according to the 2014 birth rate the number was 1.71 children. The birth rate was last lower than 1.65 in 1987, when it was 1.59. Since 1969, the birth rate has been below the population regeneration rate, which is 2.1 children per woman.
Compared to the year before, the birth rate went down for women of all ages, most clearly for those aged 28 to 29. Examined by the age of the mother and the order of the child born, the lowering of births was directed to those aged under 30 having given birth to their first child and to those aged 28 to 29 and 32 to 33 having given birth to their second child. For those having given birth to their third child, the lowering of births was divided to both younger and older age groups.
Because the birth rate went down particularly among young people, it is not surprising that first-time mothers were slightly older than before. Last year, women who gave birth to their first child were, on average. 28.8 years of age. The average age rose by 0.2 years from the year before and in ten years it has risen by 0.9 years. Correspondingly, the average age of all women that gave birth went up by one decimal from the year before, to 30.6, but over the past ten years it has risen by five decimals.
Birth rate fell sharply in the regions of Kainuu and Central Ostrobothnia
Measured with the total fertility rate, the birth rate in the region of Kainuu declined from 1.98 to 1.68 children per woman. In relative terms, the figure decreased by 15 per cent from the previous year, which was the biggest relative change by region. The birth rate diminished the second most in relative terms in the region of Central Ostrobothnia, by 13 per cent. In Central Ostrobothnia, where the birth rate was highest by region in the previous year, it went down from 2.32 to 2.01 children per woman.
The birth rate was above the rate for the whole country in 12 regions, as in the year before. At the 2015 birth rate, most children would be born in the regions of Ostrobothnia: On average, 2.05 children per woman in North Ostrobothnia, 2.01 in Central Ostrobothnia and 1.99 in South Ostrobothnia. The lowest average birth rate of 1.51 would be recorded in the region of Uusimaa. The birth rate is no longer above the population regeneration rate in any of the regions.
Birth rate highest in Seinäjoki and lowest in Helsinki
In municipalities with at least 50,000 inhabitants, the birth rate was highest in Seinäjoki, where the total fertility rate was 1.94 in the five-year period of 2011 to 2015. The second highest rate was found in Oulu, 1.92 and the third highest in Espoo, 1.86. The figure for the whole country was 1.75.
Respectively, the birth rate was lowest in Helsinki, where the total birth rate was 1.32. The rate was 1.35 in Turku and 1.45 in Tampere. In a comparison of the whole country, the birth rate in the last mentioned municipalities was also among the lowest.
Number of live births, total fertility rate and mother's mean age by live births in 2006–2015
| Year | 2006 | 2007 | 2008 | 2009 | 2010 | 2011 | 2012 | 2013 | 2014 | 2015 |
| Number of live births | 58 840 | 58 729 | 59 530 | 60 430 | 60 980 | 59 961 | 59 493 | 58 134 | 57 232 | 55 472 |
| Total fertility rate | 1,84 | 1,83 | 1,85 | 1,86 | 1,87 | 1,83 | 1,80 | 1,75 | 1,71 | 1,65 |
| Mother's mean age by all live births | 30,0 | 30,0 | 30,1 | 30,1 | 30,1 | 30,3 | 30,3 | 30,4 | 30,5 | 30,6 |
| Mother's mean age by first live birth | 28,0 | 28,1 | 28,2 | 28,2 | 28,3 | 28,4 | 28,5 | 28,6 | 28,6 | 28,8 |
Source: Births 2015. Statistics Finland
Inquiries: Timo Nikander 029 551 3250, info@stat.fi
Director in charge: Jari Tarkoma
Publication in pdf-format (321.2 kB)
- Tables
-
Tables in databases
Pick the data you need into tables, view the data as graphs, or download the data for your use.
Appendix tables
- Figures
-
- Appendix figure 1. Total fertility rate 1900 - 2015 (14.4.2016)
- Appendix figure 2. Age-specific fertility rates 2014 and 2015 (14.4.2016)
- Appendix figure 3. Age-specific fertility rates by birth order 2014 and 2015 (14.4.2016)
- Appendix figure 4. Total fertility rate by municipality for the years 2011 - 2015 (14.4.2016)
- Quality descriptions
-
- Quality description, births 2015 (14.4.2016)
Updated 14.4.2016
Official Statistics of Finland (OSF):
Births [e-publication].
ISSN=1798-2413. 2015. Helsinki: Statistics Finland [referred: 21.2.2026].
Access method: http://stat.fi/til/synt/2015/synt_2015_2016-04-14_tie_001_en.html

