Published: 23 April 2021
Decrease in birth rate stopped in 2020
According to Statistics Finland’s data on population changes, the decrease in the birth rate, which has continued for nine years, halted in 2020. At the birth rate prevailing in 2020, a woman would give birth to an average of 1.37 children, according to the 2019 birth rate 1.35 children. Altogether 344 more first-born children and 441 more second-born children were born than in 2019. Altogether 46,463 children were born, which is 850 children more than in the previous year. In 2019, the number of births still decreased by 1,964 children from the year before.
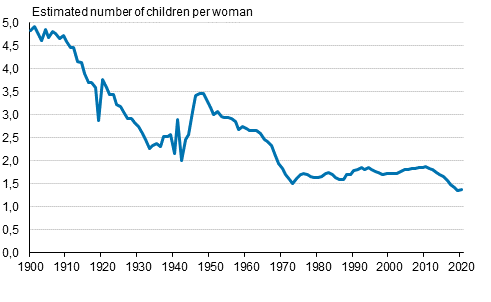
Total fertility rate in 1900 to 2020

When the number of births is taken as a proportion to the number of women of childbearing age, the birth rate can be examined. The birth rate is commonly measured with the total fertility rate, which indicates how many children a woman would give birth to during her life time if the birth rate remained the same as in the year on which the calculation is based.
In the past decade, the birth rate decreased significantly. The total fertility rate fell from 1.87 children in 2010 to 1.35 children per woman in 2019, which was the lowest ever birth rate in Finland. In 2020, the birth rate rose slightly from this, to 1.37 children per woman.
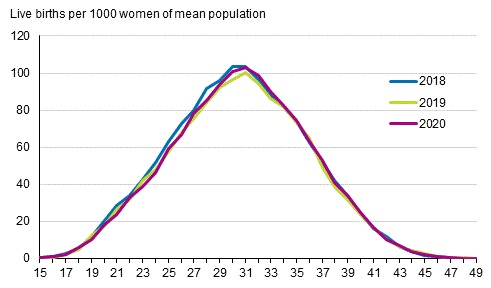
Examined by age group, the birth rate rose slightly in the 25 to 39 age groups in 2020. The age group-specific fertility rate increased most among women aged 30 to 34. For them, the fertility rate was 95 children per one thousand women in 2020, while in the previous year it was 92 children. The fertility rate also increased slightly in the 25 to 29 age group and in the 35 to 40 age group. In other age groups, the fertility rate in 2020 remained almost unchanged (those aged 40 to 44 and 45 to 49) or decreased slightly from the year before (those aged 20 to 24 and those aged 20 or under).
Age-specific fertility rates 2018, 2019 and 2020

Rise in the age of first-time parents slowed down slightly
On average, first-time mothers were aged 29.7 years, 0.1 years older than in the previous year. The growth slowed down slightly in 2020, because in 2018 and 2019 the average age rose by 0.2 years per calendar year. In ten years, the mean age at first confinement has risen by 1.4 years. The average age of all women having given birth to a living child also rose by one decimal from the previous year, to 31.3 years. In the past ten years, the average age has risen by 1.2 years (Table).
First-time fathers were, on average, of the same age as in the previous year, 31.6 years, on average. The average age of all men who became fathers was 33.7 years, one tenth more than in the previous year. Not all children born have information on their father in the Population Information System at the time of compiling the statistics. Information on fathers is updated over time. In the statistics for 2020, altogether 96 per cent of children had information about their father.
Birth rate halted with the second, third and fourth children — no increase in the birth rate of first-born children
Although the birth rate halted in 2020, new families with children did not become relatively more common. A total of 344 more first-born children were born than in 2019. When this is proportioned to women of childbearing age without children, it can be seen that no change took place in the birth rate of first-born children. Women’s fertility rate calculated by the number of children for first children remained on level with the previous year in 2020. In all, 42 per cent of all those born in 2020 were first-born children.
By contrast, women’s fertility rate according to the number of children rose slightly for the second, third and fourth children. The fall in total fertility is most strongly explained by the risen birth rate of second children: Women’s fertility rate for second children rose by five per cent. The birth rate of third children rose by two per cent and that of fourth children by eight per cent. Of all those born in 2020, altogether 34 per cent were second children, 14 per cent third children and 5 per cent fourth children.
Birth rate started to rise in 13 regions
Measured by the total fertility rate, the birth rate rose in relative terms most in Päijät-Häme, by 7.2 per cent. It was second highest in North Ostrobothnia, 6.8 per cent, and third highest in Central Ostrobothnia, 5.2 per cent.
In four regions the birth rate continued to fall, but less than in the year before, and in one region the fall rate remained relatively unchanged. Of all regions, the previous year’s small rise made a downturn of 6.3 per cent only in South Ostrobothnia.
The birth rate was above the rate for the whole country in ten regions. At the 2020 total fertility rate, the highest number of children per woman would be born in the regions of Ostrobothnia: on average, 1.87 children per woman in Central Ostrobothnia, 1.72 in North Ostrobothnia, 1.66 in Ostrobothnia, and 1.55 in South Ostrobothnia. The lowest numbers of children would be born in South Karelia, an average of 1.27 children per woman, in Pirkanmaa 1.28 and in North Karelia, 1.29 children per woman.
Although the birth rate is in relative terms highest in the regions of Ostrobothnia, in numbers most children are born in Uusimaa, 35 per cent of all births. Correspondingly, 17 per cent of births in the whole country were in the regions of Ostrobothnia in 2019. The total fertility rate was 1.30 in the region of Uusimaa, which is the fifth lowest by regional comparison.
Birth rate highest in Porvoo and lowest in Helsinki and Turku
In municipalities with at least 50,000 inhabitants, the birth rate was highest in Porvoo, where the total fertility rate was 1.56 in the five-year period 2016 to 2020. The second highest rates were found in Espoo and Seinäjoki, 1.54. The figure for the whole country in the five-year period was 1.44.
Respectively, the birth rate in the period 2016 to 2020 was lowest in Helsinki and Turku, where the total fertility rates were 1.16. The rate was 1.18 in Tampere and 1.20 in Joensuu. The birth rates in the above-mentioned municipalities were also among the lowest in a comparison of all municipalities.
Number of live births, total fertility rate and mother's and father’s mean age by live births in 2011 to 2020
| Year | 2011 | 2012 | 2013 | 2014 | 2015 | 2016 | 2017 | 2018 | 2019 | 2020 |
| Number of live births | 59 961 | 59 493 | 58 134 | 57 232 | 55 472 | 52 814 | 50 321 | 47 577 | 45 613 | 46 463 |
| Total fertility rate | 1,83 | 1,80 | 1,75 | 1,71 | 1,65 | 1,57 | 1,49 | 1,41 | 1,35 | 1,37 |
| Mother's mean age by all live births | 30,3 | 30,3 | 30,4 | 30,5 | 30,6 | 30,8 | 30,9 | 31,1 | 31,2 | 31,3 |
| Mother's mean age by first live birth | 28,4 | 28,5 | 28,6 | 28,6 | 28,8 | 29,1 | 29,2 | 29,4 | 29,6 | 29,7 |
| Father's mean age by all live births | 32,7 | 32,8 | 32,9 | 32,9 | 33,1 | 33,3 | 33,4 | 33,5 | 33,6 | 33,7 |
| Father's mean age by first live birth | 30,5 | 30,6 | 30,7 | 30,7 | 31,0 | 31,3 | 31,5 | 31,4 | 31,6 | 31,6 |
Source: Births 2020. Statistics Finland
Inquiries: Juhana Nordberg 029 551 3051, Timo Nikander 029 551 3250, info@stat.fi
Head of Department in charge: Hannele Orjala
Publication in pdf-format (304.0 kB)
- Tables
-
Tables in databases
Pick the data you need into tables, view the data as graphs, or download the data for your use.
- Figures
- Quality descriptions
-
- Quality description, births 2020 (23.4.2021)
Updated 23.4.2021
Official Statistics of Finland (OSF):
Births [e-publication].
ISSN=1798-2413. 2020. Helsinki: Statistics Finland [referred: 21.2.2026].
Access method: http://stat.fi/til/synt/2020/synt_2020_2021-04-23_tie_001_en.html

