This set of statistics has been discontinued.
Statistical data on this topic are published in connection with another set of statistics.
Data published after 5 April 2022 can be found on the renewed website.
Published: 14 December 2012
Income differentials continued growing in 2011
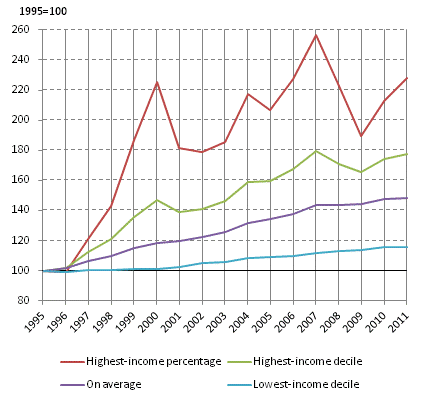
According to Statistics Finland's Total statistics on income distribution, income differentials continued growing slightly in 2011. The value of the Gini coefficient describing income differentials was 28.5, which is 0.3 percentage points more than in the previous year and 0.9 percentage points higher than in 2009. In the lowest-income decile of the population the growth of income in real terms went up by a couple of tenths of a per cent. In the highest-income decile of the population, the increase in income was 2.2 per cent. In the top-earning percentage of the population, the annual income growth was seven per cent in 2011.
Development of real income of household-dwelling population 1995-2011, 1995=100. Income concept; the house-hold-dwelling population's disposable monetary income per consumption unit, average.

For the entire population, the annual income growth measured by mean was 0.7 per cent and 0.2 per cent measured by median. The income of the top-earning population and thus also the income differentials grew again, mainly due to dividend income and sales profits.
Highest income household-dwelling units in Kauniainen, lowest income units in Rääkkylä
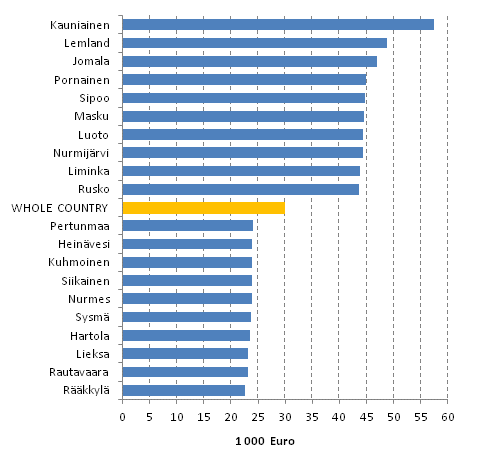
The disposable monetary income of household-dwelling units averaged EUR 37,320 in 2011. According to the median income, that better describes the situation than the mean income of household-dwelling units, the disposable monetary income of household-dwelling units was EUR 29,820. The municipality with the clearly highest median income for household-dwelling units was Kauniainen, EUR 57,480. On Åland, the corresponding income for household-dwelling units in Lemland was EUR 48,800 and EUR 46,830 for household-dwelling units in Jomala. The household-dwelling units with the lowest income are found in Eastern Finland in Rääkkylä, Rautavaara and Lieksa. The median income of household-dwelling units in Rääkkylä was EUR 22,620. In Rautavaara the median income of household-dwelling units was EUR 23,110 and EUR 23,150 in Lieksa.
In Helsinki, which is the largest municipality measured by population, the median income of household-dwelling units was EUR 29,760 in 2011. The corresponding income in Espoo was EUR 39,860, EUR 26,110 in Tampere, and EUR 34,060 in Vantaa. The median income of household-dwelling units in Turku was EUR 24,780, EUR 27,290 in Oulu, and EUR 27,150 in Jyväskylä.
The differences in income by municipality are, to some extent, explained by the size difference in household-dwelling units. For instance in Kauniainen, the average household-dwelling unit size was 2.5 persons while it was 1.9 persons in Helsinki and 1.8 persons in Turku. The avergae size of household-dwelling units in the entire country was 2.1 persons in 2011.
Disposable monetary income per household-dwelling unit in 2011. Ten highest-income and lowest-income municipalities. Income concept; disposable monetary income of household-dwelling unit, median.

Source: Total statistics on income distribution, Statistics Finland
Inquiries: Pekka Ruotsalainen 09 1734 2610, toimeentulo.tilastokeskus@stat.fi
Director in charge: Harala Riitta
- Tables
-
Tables in databases
Pick the data you need into tables, view the data as graphs, or download the data for your use.
Updated 14.12.2012
Official Statistics of Finland (OSF):
Total statistics on income distribution [e-publication].
2011. Helsinki: Statistics Finland [referred: 16.2.2026].
Access method: http://stat.fi/til/tjkt/2011/tjkt_2011_2012-12-14_tie_001_en.html

