This set of statistics has been discontinued.
Statistical data on this topic are published in connection with another set of statistics.
Data published after 5 April 2022 can be found on the renewed website.
Published: 18 December 2013
Weak income development in structural change areas
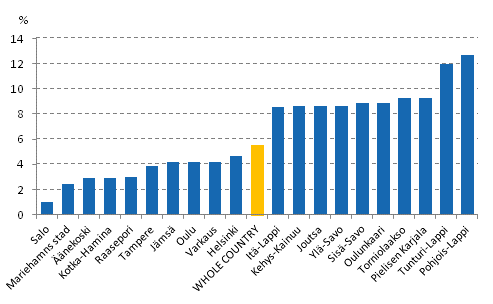
The development of income has been weak particularly among household-dwelling units located in areas that have faced considerable changes in production structures in the past few years. The median income 1) of household-dwelling units for the whole country grew by 5.5 per cent from 2007 to 2012. In the sub-regional unit of Salo that has experienced structural changes, the growth of the income of household-dwelling units was only one per cent. Income development was also modest in the sub-regional units of Äänekoski, Kotka-Hamina and Raasepori that all have faced structural changes and where income growth was clearly below the income development for the whole country. This is indicated by the regional data of Statistics Finland’s Total statistics on income distribution.
Household-dwelling units' real income change from 2007 to 2012. Ten sub-regional units with the largest and the smallest change

Income of household-dwelling units decreased in Kaskinen and Hanko
Income development was best in the household-dwelling units in the sub-regional units of Pohjois-Lappi and Tunturi-Lappi, where the income level in 2012 was good ten per cent higher than in 2007. The good income development is explained by growth in wage income and old-age pensions. In the sub-regional unit of Helsinki, the country’s biggest in terms of population, household-dwelling units' income grew by good 4.5 per cent from 2007 to 2012, which is less than the growth in the median income of household-dwelling units for the whole country.
Examined by municipality, the real income of household-dwelling units in Kaskinen and Hanko have decreased even during the ongoing economic downturn. Both municipalities belong to areas that have faced considerable changes in production structures in the past few years. In Kaskinen, the median for equivalent disposable monetary income, which takes into account the size difference in household-dwelling units decreased by 2.6 per cent from 2007 to 2012. For household-dwelling units in Hanko, the corresponding drop was one and a half per cent. In both cases the drop in income is explained by a considerable decrease in wage and salary income, entrepreneurial income and property income, or factor income. Among large towns, the income of household-dwelling units in Helsinki grew by 5.3 per cent in 2007 to 2012. The income growth for household-dwelling units in Turku, Espoo and Oulu was around four per cent. In Vantaa, the corresponding income growth was 3.8 per cent and in Tampere 3.3 per cent.
Income development of household-dwelling units weak in 2012
The real income development of household dwelling-units was modest in 2012. The median for disposable money income, which best describes the income of average household-dwelling units, was only 0.4 per cent higher in 2012 than one year previously. Measured by mean income, the income of household-dwelling units actually decreased in 2012 from the year before, the drop amounted to 1.2 per cent. The weak income development is caused by decreased factor income, which is due to the weak economic situation that has continued for a long time, increased unemployment, and a down-turn in entrepreneurial activity.
1) Income concept; disposable monetary income of household-dwelling unit divided by household-dwelling unit's consumption unit figure, median. The consumption unit figure is formed by giving the first adult in the household-dwelling unit the weight 1, others over the age of 14 are each given the weight 0.5. Children under the age of 14 are each given the weight 0.3.
Source: Total statistics on income distribution, Statistics Finland
Inquiries: Pekka Ruotsalainen 09 1734 2610
Director in charge: Harala Riitta
- Tables
-
Tables in databases
Pick the data you need into tables, view the data as graphs, or download the data for your use.
Updated 18.12.2013
Official Statistics of Finland (OSF):
Total statistics on income distribution [e-publication].
Income development by area 2012. Helsinki: Statistics Finland [referred: 11.2.2026].
Access method: http://stat.fi/til/tjkt/2012/01/tjkt_2012_01_2013-12-18_tie_001_en.html

