This set of statistics has been discontinued.
Statistical data on this topic are published in connection with another set of statistics.
Data published after 5 April 2022 can be found on the renewed website.
Published: 18 December 2015
Households in Salo region have been most punished by the recession
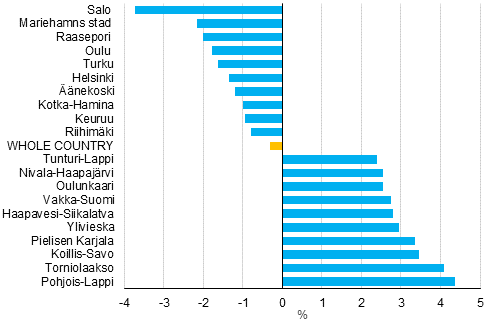
The median for household-dwelling units' disposable monetary income was in real terms 0.3 per cent smaller in 2014 than in 2010. Households in the Salo region have lost most of their income, as their real income was last year 3.7 per cent lower than in 2010. According to the regional data of Statistics Finland's Total statistics on income distribution, income has also been lost in households in the sub-regional units of Raasepori, Oulu, Äänekoski, Kotka-Hamina and Keuruu, which have experienced sizeable structural changes.
Household-dwelling units’ real changes in income in 2010 to 2014, %. Twenty sub-regional units that have lost and grown most income

Income concept: equivalent disposable monetary income of the household-dwelling unit, median. Equivalent disposable monetary income = disposable monetary income of the household-dwelling unit divided by the household-dwelling unit’s consumption unit figure
In the sub-regional unit of Helsinki, which has the highest population, the income of household-dwelling units went down in real terms by one-and-a-half per cent in 2010 to 2014. In the sub-regional unit of Turku, income loss was of the same magnitude.
Households in the sub-regional units of Northern and Eastern Finland have fared best in the comparison of income development in recent years. In the sub-regional units of Pohjois-Lappi and Tornionlaakso, the median for household-dwelling units' disposable monetary income was in real terms good four per cent higher in 2014 than in 2010. Household-dwelling units in the sub-regional units of Koillis-Savo and Pielisen Karjala reached a growth of over three per cent.
Income development gloomy in Finnish households in the 2010s
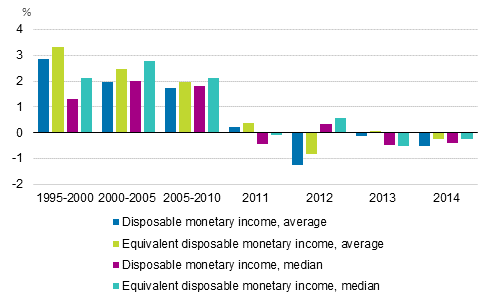
Finnish households' income development has been weak in recent years. The real changes in household-dwelling units' disposable monetary income was negative in 2014 for the second successive year measured by all available income indicators. Income development has continued weak already since the turn of the 2010s. Before that, households' income development was clearly positive with all indicators.
Real annual changes in household-dwelling units’ income in 1995 to 2014

Income changes in 1995 to 2000, 2000 to 2005 and 2005 to 2010 are average annual changes in those periods
Source: Total statistics on income distribution, Statistics Finland
Inquiries: Pekka Ruotsalainen 029 551 2610
Director in charge: Jari Tarkoma
- Tables
-
Tables in databases
Pick the data you need into tables, view the data as graphs, or download the data for your use.
Updated 18.12.2015
Official Statistics of Finland (OSF):
Total statistics on income distribution [e-publication].
Income development by area 2014. Helsinki: Statistics Finland [referred: 17.2.2026].
Access method: http://stat.fi/til/tjkt/2014/01/tjkt_2014_01_2015-12-18_tie_001_en.html

