This set of statistics has been discontinued.
Statistical data on this topic are published in connection with another set of statistics.
Data published after 5 April 2022 can be found on the renewed website.
Published: 18 December 2015
Income differentials decreased slightly in 2014
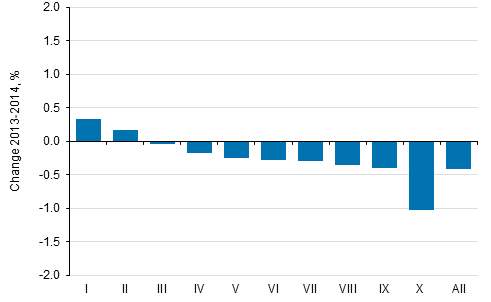
Statistics Finland's total statistics on income distribution show that income differentials narrowed somewhat in 2014 compared with the previous year. The narrowing of differentials was due to the reduced income of high-income and medium-income groups and the slightly growing income of low-income groups. The income level of the population's highest-income decile went down by one per cent in real terms from 2013 to 2014. The income level of the lowest-income decile rose by 0.3 per cent. The real income of the whole population diminished by 0.4 per cent.
Change in average real income (%) by income decile from 2013 to 2014

Income decile: the population is arranged according to income and divided into ten equal parts, each of which has around half a million persons. Income decile I is the lowest-income decile and income decile X the highest-income decile. Income concept: equivalent disposable monetary income of household dwelling-unit, average per person. Equivalent income: the household-dwelling unit’s income divided by its consumption units.
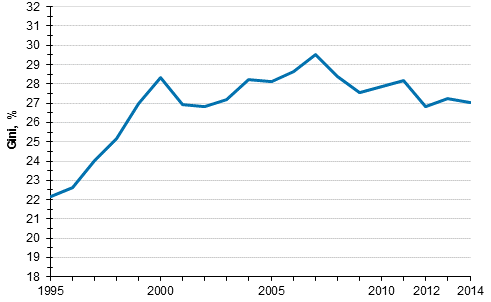
The Gini coefficient describing relative income differentials was 0.2 percentage points lower in 2014 than in the year before and received the value 27.0. The Gini coefficient was at its largest in 2007, compared with which it was over two percentage points smaller in 2014. Compared with 1995, the Gini coefficient has grown by around five percentage points, most of which is caused by income differentials growing fast in the late 1990s. The Gini coefficient gets the value 0 if everyone receives the same amount of income and 100 if one income earner receives all the income. The higher the Gini coefficient, the higher the income differentials are.
Development of income inequality 1995–2014, Gini coefficient (%)

Persons belonging to the household-dwelling population, the household-dwelling unit's disposable money income per consumption unit. Data for years 1995–2009 and 2010–2014 are not fully comparable. The income concept was supplemented in 2010, which lowered the Gini coefficient by 0.3 percentage points.
Source: Total statistics on income distribution, Statistics Finland
Inquiries: Veli-Matti Törmälehto 029 551 3680
Director in charge: Jari Tarkoma
- Tables
-
Tables in databases
Pick the data you need into tables, view the data as graphs, or download the data for your use.
Updated 18.12.2015
Official Statistics of Finland (OSF):
Total statistics on income distribution [e-publication].
Income inequality 2014. Helsinki: Statistics Finland [referred: 17.2.2026].
Access method: http://stat.fi/til/tjkt/2014/02/tjkt_2014_02_2015-12-18_tie_002_en.html

