This set of statistics has been discontinued.
Statistical data on this topic are published in connection with another set of statistics.
Data published after 5 April 2022 can be found on the renewed website.
Published: 18 December 2018
Good economic development of the past few years has increased the income of household-dwelling units most in Lapland
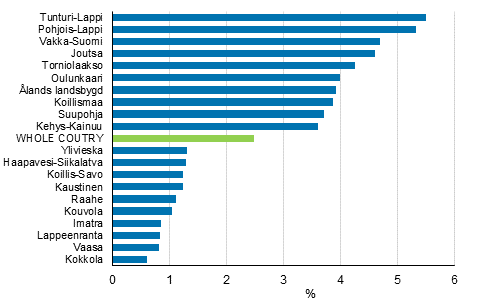
Good economic development of the past few years has increased the income of household-dwelling units most in LaplandAccording to Statistics Finland’s total statistics on income distribution, the median income of household-dwelling units in Finland was in real terms 2.5 per cent higher last year than in 2014, which marked the ending to the contraction of Finland’s economy that had lasted for several years. The income development has been best in the sub-regional units of Tunturi-Lappi and Pohjois-Lappi, where the real income of household-dwelling units was around 5.5 per cent higher in 2017 than in 2014. The corresponding growth in income was 4.7 per cent in the sub-regional unit of Vakka-Suomi in Southwestern Finland.
Real changes (%) in household-dwelling units' median income in 2014 to 2017. Ten sub-regional units with the highest and lowest growth

Income concept equivalent disposable monetary income of the household-dwelling unit (incl. sales profits), median
The good growth in the median income of household-dwelling units in Tunturi-Lappi and Pohjois-Lappi seems to be explained by the rapid real growth in earned and entrepreneurial income, which was good six per cent in household-dwelling units of these areas in 2014 to 2017 measured by mean income. The good growth in the median income of household-dwelling units in Vakka-Suomi appears to be caused most of all by the fast growth in earned income received by household-dwelling units.
In the areas of Northern Lapland the good income development of earned and entrepreneurial income is largely explained by tourism and its growth. The good growth in earned income of household-dwelling units in Vakka-Suomi is probably due to the successful manufacturing activity in the area in recent years, such as the automobile, food and shipbuilding industries.
The income development of household-dwelling units has been weakest in recent years in Ostrobothnia in the sub-regional units of Kokkola and Vaasa and in South Karelia in the sub-regional units of Lappeenranta and Imatra. In these areas the real growth of household-dwelling units’ median income remained close on one per cent in 2014 to 2017.
Growth still modest in real income of average households in 2017
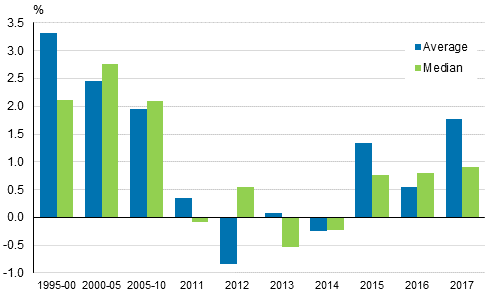
The income development of Finnish households has been weak in the 2010s, in the early years of the decade household-dwelling units’ disposable monetary income even fell in real terms. In 2015, household-dwelling units’ income development turned clearly positive after a long time, but in the past few years, the growth rate of real income has not much accelerated.
The real income of household dwelling-units grew in 2017 measured by the mean by 1.8 per cent from the previous year. In turn, according to the median income that best describes the income of average household-dwelling units, the real growth in household-dwelling units’ income stood at nearly one per cent in 2017.
Annual changes in household dwelling-units’ real income in 1995 to 2017 (

Change in 1995 to 2000, 2000 to 2005 and 2005 to 2010 describes the average annual change in the period. Income concept: equivalent disposable monetary income (excl. sales profits), average per household-dwelling unit (corrected on 18 December 2018 at 11:00 am). Equivalent income = the household-dwelling unit's income divided by its consumption unit figure. (Corrected on 18 December 2018 at 11:00 am)
Source: Total statistics on income distribution, Statistics Finland
Inquiries: Pekka Ruotsalainen 029 551 2610
Director in charge: Jari Tarkoma
Publication in pdf-format (169.6 kB)
- Tables
-
Tables in databases
Pick the data you need into tables, view the data as graphs, or download the data for your use.
Updated 18.12.2018
Official Statistics of Finland (OSF):
Total statistics on income distribution [e-publication].
Income inequality 2017. Helsinki: Statistics Finland [referred: 11.2.2026].
Access method: http://stat.fi/til/tjkt/2017/02/tjkt_2017_02_2018-12-18_tie_002_en.html

