Published: 20 May 2009
Growth of income differentials continued in 2007
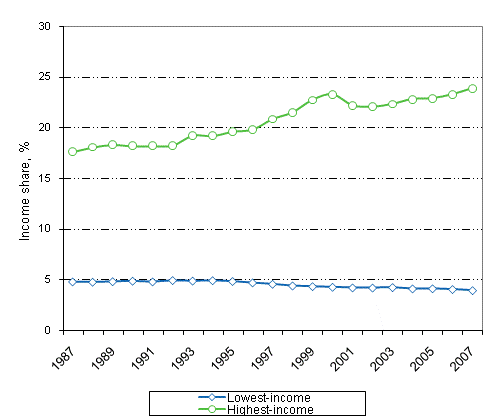
The development in the income of the lowest-income population groups was weaker than the average in 2007 and income differentials grew from the previous year in Finland. The median disposable income per consumption unit grew by 2,4 per cent among the household population. The median income of the lowest-income decile diminished by 0.4 per cent while that of the highest-income decile grew by 3.4 per cent. Relative to the whole population, the development in the income of certain low-income groups, such as students and single carers, has been very weak throughout the 2000s.
Figure 1. Development in the income share of the highest and lowest-income decile in 1987-2007

Income differentials between the socio-economic groups have grown in the 2000s. Measured with equivalent disposable income, students are the lowest-income socio-economic group with the median income of EUR 9,200 in 2007, whereas the same figure for all households was EUR 20,900. From 2006 to 2007, students’ income diminished by nearly 4 per cent, which puts it at the same level as in 2000. Unemployed and other economically inactive persons were the socio-economic groups with the next lowest income. In these groups, too, income has been growing more slowly than the average for all households in the 2000s. The income of the socio-economic group with the next lowest income, i.e. pensioner households, grew by only 0.6 per cent from the previous year in 2007.
The income level of the households of self-employed persons was just over EUR 26,000 and the development in their income was the most favourable among all socio-economic groups in 2007. Upper-level salaried employees were the socio-economic group with the highest income level of good EUR 30,000. The income of upper-level salaried employees has developed averagely in recent years.
The development in the income of families with children has been weaker than average for a long time. The development in the income of two-carer families with children has halted to the level of 2005, at around EUR 22,500. The income of single carers has been falling continuously since 2004. In 2007, it amounted to EUR 15,400. By contrast, the development in the income of couples without children has for a long time now been better than in other population groups. This favourable development continued in 2007: their income grew by 2.6 per cent from the previous year. The income growth in one-person households has been slightly weaker than the average in the 2000s. The income level of young and aged single persons has remained clearly below that of single persons between the ages of 35 and 64.
Approximately 35 per cent of the population lived in rented dwellings. The majority of these 777,000 households were one- or two-person households. Among the persons living in rental dwellings the disposable income per consumption unit was around 60 per cent of the income of persons living in owner-occupied dwellings. Since 1995, income level has risen by 40 per cent among persons living in owner-occupied dwellings and by 20 per cent among persons living in rental dwellings.
By international comparison, income inequality in Finland is still lower than the average in Europe or among OECD countries. In a comparison of 28 European countries, relative income differentials in Sweden, Norway and Denmark, as well as in Slovenia, Slovakia, the Czech Republic and Hungary were smaller than in Finland. Among the compared countries, relative income differentials were largest in Portugal, the Baltic States, Greece and Great Britain. However, a study concerning the OECD countries showed that since the mid-1990s income differentials have grown faster in Finland than in any other OECD country.
Source: Income Distribution Statistics 2007, Statistics Finland
Inquiries: Juha Honkkila (09) 1734 3651, Hannele Sauli (09) 1734 3497
Director in charge: Riitta Harala
Publication in pdf-format (292.9 kB)
- Tables
-
Tables in databases
Pick the data you need into tables, view the data as graphs, or download the data for your use.
Appendix tables
- 1. Income shares of decile groups (%) in 1966-2007. Decile groups have been formed among persons according to disposable income per consumption unit (20.5.2009)
- 2. Gini-coefficients for factor income, gross income and disposable income, and redistributive effect of current transfers on income differentials in 1966 - 2007. (20.5.2009)
- 3a. Mean income by decile group in 1987 - 2007. Decile groups have been formed among persons according to disposable income per consumption unit (20.5.2009)
- 3b. Median income by decile group in 1987 - 2007. Decile groups have been formed among persons according to disposable income per consumption unit (20.5.2009)
- 4. Upper limit on income by decile group in 1987 - 2007. Decile groups have been formed among persons according to disposable income per consumption unit (20.5.2009)
- 5. Household income: structure by brackets ordered according to households' disposable income 2007. (20.5.2009)
- 6. Household income: structure by brackets ordered according to households' gross income 2007. (20.5.2009)
Updated 20.5.2009
Official Statistics of Finland (OSF):
Income distribution statistics [e-publication].
ISSN=1799-1331. 2007. Helsinki: Statistics Finland [referred: 19.2.2026].
Access method: http://stat.fi/til/tjt/2007/tjt_2007_2009-05-20_tie_001_en.html

