Published: 9 April 2015
Income differential between people living in owner-occupied and rented dwellings grew in 2013
The income level of households living in owner-occupied dwellings remained unchanged (0.3% growth). The income level of households living in rented dwellings decreased by 3.7 per cent in relative terms from the year before. These data derive from Statistics Finland’s income distribution statistics .
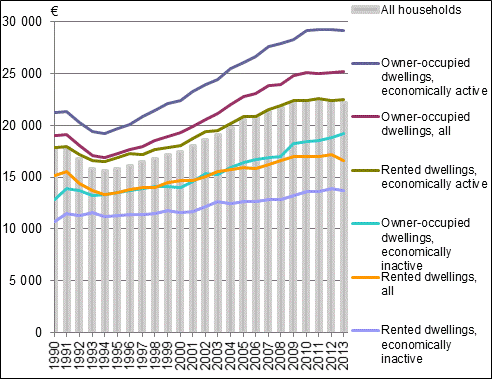
Figure Household's disposable monetary income per consumption unit in 1990 to 2013, median, in 2013 money.

The median for equivalent disposable income of households calculated per consumption unit was EUR 25,200 for households living in owner-occupied dwellings and EUR 16,560 for households living in rented dwellings in 2013. The average disposable income of all households was EUR 22,230 (median) per consumption unit, which is 0.9 per cent lower in real terms than one year earlier.
Households living in rented dwellings have increasingly lower income than households living in owner-occupied dwellings. The income development by form of tenure of dwelling has become differentiated also in the long-term since the second half of the 1990s. For example, from 1997 to 2011, the income level of households living in rented dwellings grew on average in real terms by around 21 per cent and for households living in owner-occupied dwellings by around 39 per cent. Since 2011, the income level of households has in general weakened slightly. During 2011 to 2013, the median for equivalent disposable income of households living in rented dwellings decreased in real terms by 2.3 per cent, while the income of households living in owner-occupied dwellings increased marginally by 0.6 per cent. As a result of actual income development, the income level of households living in rented dwellings was more than 34 per cent lower than that of households living in owner-occupied dwellings in 2013. In 1995 to 1997, the income level of households living in rented dwellings has been around 22 per cent lower and when the income level folded in 2011, over 32 per cent lower compared to households living in owner-occupied dwellings.
The income differentials between households living in rented and owner-occupied dwellings are smaller in groups defined by economic activity than in all households. In economically active households, the income level of those living in rented dwellings was around 23 per cent lower than that of households living in owner-occupied dwellings in 2013. The differences are higher among the economically inactive as there are plenty of pensioners, unemployed and students at risk of poverty among those living in rented dwellings. In economically inactive households, the income level of those living in rented dwellings was nearly 29 per cent lower than that of households living in owner-occupied dwellings. When comparing in particular the income development of economically active households, the income level of households living in rented dwellings rose by nearly 32 per cent in 1997 to 2011 and by around 40 per cent for households living in owner-occupied dwellings. During 2011 to 2013, among economically active households, the income level of households living in rented dwellings decreased by 0.6 per cent and that households living in owner-occupied dwellings by 0.4 per cent.
The housing costs of households living in owner-occupied dwellings accounted for 11.0 per cent (decreased by 0.5 percentage points year-on-year), on average, and those of households living in rental dwellings for 26.6 per cent (increased by 0.8 percentage points year-on-year) of disposable monetary income in 2013. The income share of housing costs was nearly as high (around 11%) for owner-occupiers of indebted and debt-free dwellings. The housing costs of all households were, on average, 14.7 per cent of disposable monetary income, which is roughly the same (decreased by 0.3 percentage points) as in 2012. These data are median figures calculated on the basis of household-specific income shares of housing costs. The data include operating expenditure, interests on and amortisations of housing loans. They do not include housing allowances received as current transfers and the tax deduction benefit for interests on housing loans. After paying the housing costs, the median for equivalent disposable income was altogether EUR 21,895 for households living in owner-occupied dwellings, EUR 19,158 for debt-free dwellings and EUR 24,359 for indebted dwellings. The income level of households living in rented dwellings was one-half (50.3%) lower than for households living in owner-occupied dwellings, EUR 10,887. For all households, the income level after paying housing costs was around EUR 18,485 in 2013. From the previous year, the income after housing costs for households with housing loans developed more favourably than for other households. This was partially affected by lower interest expenses on housing loans.
Housing costs were considerably high (over 40 per cent of disposable monetary income) for 190,700 households, which was around 7.3 per cent of all households in 2013. The number grew by around 11 per cent from the previous year. These households had 264,900 members, which was 4.9 per cent more than in the year before. The population groups that have higher housing costs than average (over 40 per cent of disposable monetary income) are such as low income earners (the two lowest income decile groups), rental dwellers, those living in the major region of Helsinki-Uusimaa, single-person households, and households of self-employed persons, unemployed persons, students and other economically inactive persons.
Source: Income Distribution Statistics 2013, Statistics Finland
Inquiries: Marie Reijo 029 551 2547
Director in charge: Riitta Harala
Publication in pdf-format (218.1 kB)
- Tables
-
Tables in databases
Pick the data you need into tables, view the data as graphs, or download the data for your use.
Updated 9.4.2015
Official Statistics of Finland (OSF):
Income distribution statistics [e-publication].
ISSN=1799-1331. Income, housing and housing expenditure 2013. Helsinki: Statistics Finland [referred: 7.2.2026].
Access method: http://stat.fi/til/tjt/2013/02/tjt_2013_02_2015-04-09_tie_001_en.html

