Published: 21 December 2017
Number of persons at risk of poverty in 2016 on level with the previous year
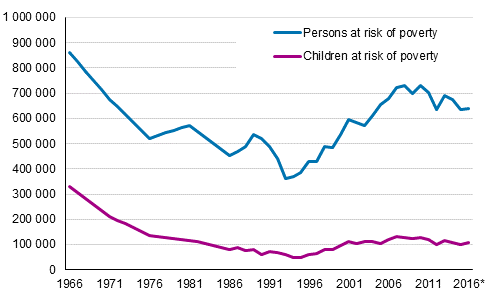
Statistics Finland's income distribution statistics indicate that the number of persons belonging to households at risk of poverty was 637,000 in 2016. The share of persons at risk of poverty in the household population was 11.8 per cent, which is on level with the previous year. In the 50-year period covered by the income statistics, the risk of poverty has been at its highest in 1966, when 18.6 per cent of the population were at risk of poverty. In relative terms, the number of persons at risk of poverty was lowest in the year of recession 1993, when the average income fell fast. The share of people at risk of poverty was then 7.2 per cent of the whole population.
Population at risk of poverty and number of children at risk of poverty in Finland in 1966 to 2016*.

Income concept: equivalent disposable money income (excl. capital gains). Sources: 1966, 1971, 1976 and 1981 Household Burdget Survey, 1986–2016 Income Distribution Statistics. The missing intervening years (1967 to 1985) have been linearly interpolated. The data concerning 2016 are preliminary.
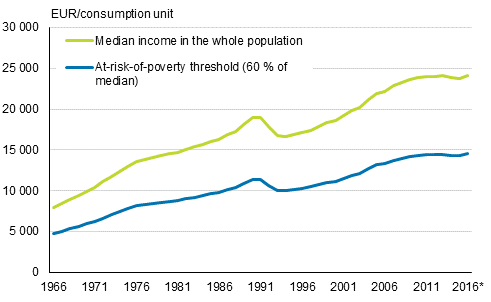
The relative risk of poverty decreased as a trend between 1966 and 1993. Measured by median income, the income level of the whole population increased at the same time. At the beginning of the 1990s, the median income of the population and the relative at-risk-of-poverty threshold fell as a consequence of the recession. At the same time, the number of persons at risk of poverty decreased fast, because the income of medium-income earners diminished in relative terms more than that of low-income earners.
After 1993, both the number of persons at risk of poverty and the median income of the whole population have grown. At its highest, the number of persons at risk of poverty was between 2007 and 2010, when their number was over 700,000 per year, on average. The share of persons at risk of poverty has decreased slightly since then, and after 2011, their number has been 650,000 per year, on average. The growth in the median income also started to slow down after 2007, and from 2010 onwards, the median income has annually been around EUR 24,000 per consumption unit. The number of children belonging to households at risk of poverty has varied between around 100,000 and 130,000 in the 2000s.
Median income of the whole population and relative at-risk-of-poverty threshold (60 %) in 1966 to 2016*, EUR/consumption unit in year 2016 value.

Income concept: equivalent disposable money income (excl. capital gains). Sources: 1966, 1971, 1976 and 1981 Household Burdget Survey, 1986–2016 Income Distribution Statistics. The missing intervening years (1967 to 1985) have been linearly interpolated. The data concerning 2016 are preliminary.
The median income per consumption unit for the whole population was EUR 24,160 in 2016. The at-risk-of-poverty threshold for a one-person household was EUR 14,500, that is, around EUR 1,210 per month, while in the year before, it was EUR 14,280 or EUR 1,190 per month. Persons at risk of poverty describe the relative income differentials of medium-income and low-income groups, so the development of persons at-risk-of-poverty depends not only on the income development of low-income households, but also on the development of median income. Persons are classified as being at-risk-of-poverty when the household's disposable monetary income per consumption unit 1) is below 60 per cent of the national median income.
1) The consumption units are based on the so-called OECD's modified scale. One adult in the household is one consumption unit. Other persons in the household aged at least 14 each are 0.5 consumption units and children aged 0 to 13 each are 0.3 consumption units. A household with one adult member is one consumption unit, while a household consisting of spouses and one child aged under 14 together are 1.8 consumption units.
Source: Income Distribution Statistics 2016, Statistics Finland
Inquiries: Kaisa-Mari Okkonen 029 551 3408
Director in charge: Jari Tarkoma
- Tables
-
Tables in databases
Pick the data you need into tables, view the data as graphs, or download the data for your use.
Appendix tables
- Quality descriptions
-
- Quality report: Income Distribution Statistics (21.12.2017)
Updated 21.12.2017
Official Statistics of Finland (OSF):
Income distribution statistics [e-publication].
ISSN=1799-1331. Poverty 2016. Helsinki: Statistics Finland [referred: 13.2.2026].
Access method: http://stat.fi/til/tjt/2016/01/tjt_2016_01_2017-12-21_tie_001_en.html

