This set of statistics has been discontinued.
New data are no longer produced from the statistics.
Published: 19 December 2007
Proportion of highly educated population highest in the Region of Uusimaa
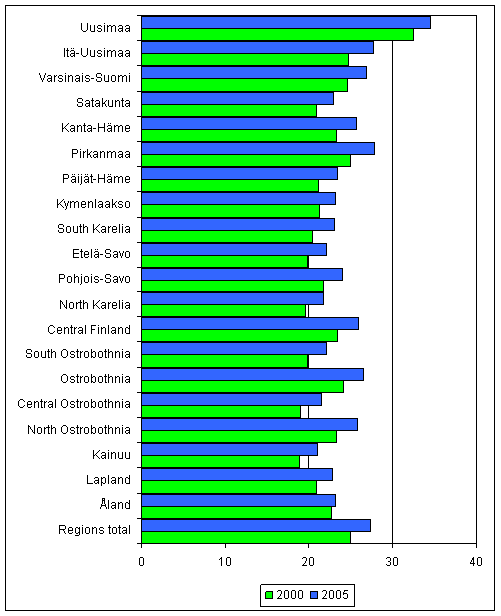
Twenty-seven per cent of the country’s population aged 16 to 74 held a tertiary level educational qualification in 2005. The share of highly educated population had increased by two percentage points since 2000, and was the highest in the Region of Uusimaa at 35 per cent. The Region of Kainuu had the lowest share of 21 per cent. Thirty-five per cent of the highly education population lived in Uusimaa, nine per cent in both Varsinais-Suomi and Pirkanmaa and approximately seven per cent in North Ostrobothnia. The share had increased most since 2000 in the Regions of Pirkanmaa and North Ostrobothnia and diminished most in the Regions of Lapland, Kainuu, Pohjois-Savo and Etelä-Savo.
Share of highly educated population of total population by region in 2005

In 2005, the proportion of highly educated employees of all employed labour force increased slightly from the previous year, when it was 36 per cent. As a proportion of all employed persons, 5.4 per cent of them were unemployed.
The share of highly educated employees was the highest, or 18 per cent, in human health activities. One-third of those with a doctorate level degree were employed by universities and approximately 16 per cent by human health activities. Around 29 per cent of those with a higher level university degree worked in the field of education. The largest shares of holders of other tertiary degrees were employed by human health activities (21%), trade (13%) and business services (11%).
Highly educated employees by economic activity and completed degree in 2005
| Share of employees, % |
Doctorate level degree % |
Higher-degree level % |
Other tertiary degrees % |
Total % |
|
| Agriculture, forestry and fishery | 18.0 | 0.3 | 0.8 | 2.4 | 1,9 |
| Mining and quarrying | 18.2 | 0.0 | 0.1 | 0.1 | 0,1 |
| Food, textiles | 18.9 | 0.3 | 0.7 | 1.4 | 1,2 |
| Wood products, pulp, paper product | 27.5 | 2.3 | 3.8 | 4.3 | 4,1 |
| Metals, machinery and equipmen | 28.1 | 2.5 | 4.4 | 6.3 | 5,7 |
| Computers, telecommunication equipment | 59.3 | 2.5 | 3.8 | 2.1 | 2,6 |
| Other manufacturing | 20.7 | 0.2 | 0.4 | 1.0 | 0,8 |
| Electricity, gas and water supply | 42.0 | 0.2 | 0.6 | 0.9 | 0,8 |
| Construction | 16.8 | 0.2 | 0.7 | 3.8 | 2,9 |
| Trade | 25.4 | 1.7 | 5.0 | 13.2 | 10,7 |
| Transport, communications | 17.6 | 0.4 | 1.4 | 3.9 | 3,1 |
| Telecommunications | 51.6 | 0.2 | 0.9 | 1.3 | 1,2 |
| Financial and insurance intermediatio | 61.0 | 0.9 | 3.0 | 3.4 | 3,2 |
| Computer and related activities | 62.2 | 1.3 | 3.8 | 2.8 | 3,0 |
| Business services | 39.5 | 4.6 | 10.4 | 10.6 | 10,4 |
| Public sector research institutes | 71.9 | 8.0 | 1.8 | 0.4 | 1,0 |
| Other research activities | 69.7 | 1.7 | 0.4 | 0.1 | 0,3 |
| Universities | 74.7 | 32.9 | 4.9 | 0.7 | 2,7 |
| Other higher education | 84.2 | 4.1 | 1.5 | 0.3 | 0,7 |
| Other education | 71.4 | 7.0 | 22.3 | 6.4 | 10,7 |
| Human health activities | 44.2 | 15.8 | 11.9 | 20.9 | 18,3 |
| Public administration | 57.9 | 8.1 | 10.1 | 7.8 | 8,4 |
| Other economic activities | 34.6 | 3.5 | 5.9 | 4.5 | 4,9 |
| Activity unknown/missing | 21.9 | 1.3 | 1.3 | 1.2 | 1,2 |
| Economic activities, total | 36.3 | 100.0 | 100.0 | 100.0 | 100,0 |
Source: Human resources of science and technology 2006. Statistics Finland
Inquiries: Markku Virtaharju (09) 1734 3290
Director in charge: Kaija Hovi
Publication in pdf-format (11 pages 264.6 kB)
- Tables
-
Tables in databases
Pick the data you need into tables, view the data as graphs, or download the data for your use.
Appendix tables
- 1. Tertiary degrees by the field of science in 1991-2006 (19.12.2007)
- 2. Population with tertiary level education in 2000 and 2005 (19.12.2007)
- 3. Population with tertiary level education by the principal activity in 2005 (19.12.2007)
- 4. Employed population with tertiary level education by industry in 2005 (19.12.2007)
- Figures
-
- 1. Doctorate and licentiate degrees in 1991 - 2006 (19.12.2007)
- 2. Persons with tertiary degrees as a proportion of the population aged 16 to 74 in 2001 - 2005 (19.12.2007)
- 3. Persons with doctorate degree, median ages by the field of science in 1991 - 2006 (19.12.2007)
- 4. Unemployment rates of persons with doctorate level and higher-degree level tertiary education by the field of science in 2005 (19.12.2007)
- 5. Doctorate level degrees and the proportion of women 1995 - 2006 (19.12.2007)
- 6. Persons with doctorate level and higher-degree level tertiary education as a percentage by the field of science in 2005 (19.12.2007)
Updated 19.12.2007
Statistics:
Human resources of science and technology [e-publication].
ISSN=1797-3244. 2006. Helsinki: Statistics Finland [referred: 15.2.2026].
Access method: http://stat.fi/til/tthv/2006/tthv_2006_2007-12-19_tie_001_en.html

