Published: 30 January 2009
Industrial output fell by 15.6 per cent year-on-year in December
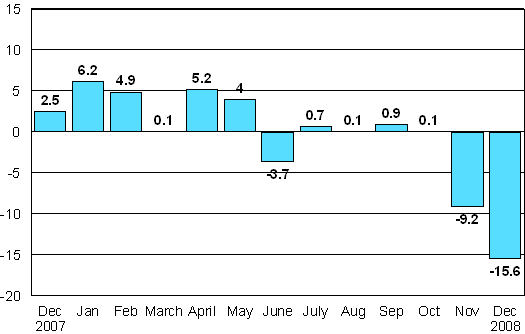
According to Statistics Finland, industrial output adjusted for working days was 15.6 per cent lower in December 2008 than twelve months earlier. In November industrial output fell by good 9 per cent year-on-year. In 2008 industrial output decreased by just under one per cent. The last time industrial output fell more than this was during the deepest recession in 1991, when output fell by as much as 8.7 per cent.
The global economic downturn hit Finland's industrial output in late autumn. Lay-offs have increased and output is record low. In late 2008 industrial output fell even faster and reached lower levels than during the 1991 recession.
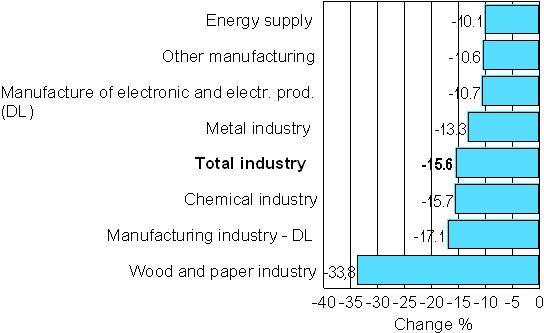
Output fell in all main industries in December. The decline in output steepened when compared with November. In December, output in the metal industry fell by good 13 per cent. Output declined most, by close on 34 per cent, in the wood and paper industry.
Capacity utilisation rate in manufacturing was 67 per cent in December, which was nearly 13 percentage points lower than in last year's corresponding month. Capacity utilisation rate in manufacturing has not been as low as in December for the past 13 years.
Working day adjusted change in industrial output by industry 12/2007-12/2008, %

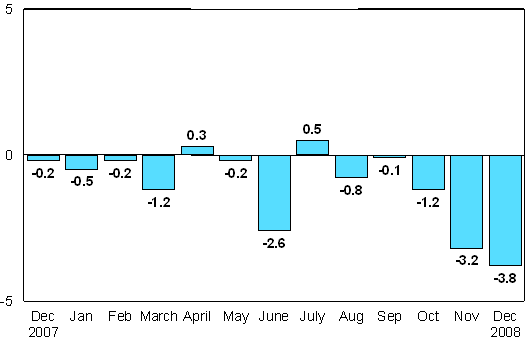
Seasonally adjusted change in industrial output from previous month, %

Working day adjusted change in industrial output from corresponding month of previous year, %

Release timetable of Volume Index of Industrial Output in 2009
In 2009, the Volume Index of Industrial Output will be released at the lag of approximately 40 days, in other words on the 10th day of each month or on the weekday preceding it. For example, the Volume Index of Industrial Output for January 2009 will be released on 10 March 2009.
Release dates for the Volume Index of Industrial Output in 2009 are listed below:
| Index month | 2009 |
| January | 10 March |
| February | 9 April |
| March | 8 May |
| April | 10 June |
| May | 10 July |
| June | 10 August |
| July | 10 September |
| August | 9 October |
| September | 10 November |
| October | 10 December |
A project on a revision of the Volume Index of Industrial Output was launched in 2006 and will continue through the year 2009. During the project the coverage of small and medium-sized enterprises has been improved, and volume data have been replaced with value data in the Volume Index, as well as the data inquiry widened to the most important industrial services. At the same time the data collection for the Volume Index of Industrial Output has been expanded. Price data are required for the deflation of value data in the compilation of the Volume Index.
The revised standard industrial classification TOL 2008 will also be introduced when the Volume Index of Industrial Output is released in January 2009. For further information on this see: http://tilastokeskus.fi/til/ttvi/ttvi_2008-09-26_luo_001_en.html
Source: Volume Index of Industrial Output 2008, December. Statistics Finland
Inquiries: Mr Kari Rautio +358 9 1734 2479, volyymi.indeksi@stat.fi
Director in charge: Ms Hannele Orjala
- Tables
-
Tables in databases
Pick the data you need into tables, view the data as graphs, or download the data for your use.
Last updated 30.1.2009
Official Statistics of Finland (OSF):
Volume index of industrial output [e-publication].
ISSN=1798-9272. December 2008. Helsinki: Statistics Finland [referred: 17.2.2026].
Access method: http://stat.fi/til/ttvi/2008/12/ttvi_2008_12_2009-01-30_tie_001_en.html

