

Appendix figure 2. Seasonally adjusted change percentage of industrial output November 2013 /December 2013, TOL 2008
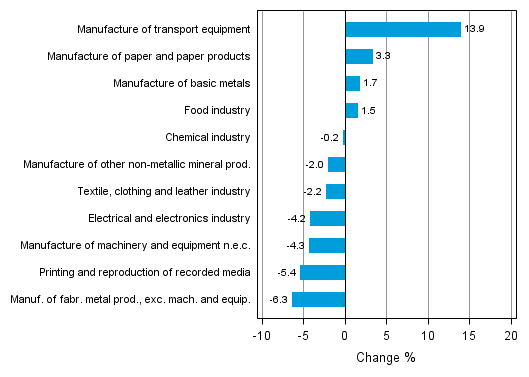
Source: Volume Index of Industrial Output 2013, December. Statistics Finland
Inquiries: Kari Rautio 09 1734 2479, Salla Simola 09 1734 3308, volyymi.indeksi@stat.fi
Director in charge: Hannele Orjala
Updated 10.2.2014
Official Statistics of Finland (OSF):
Volume index of industrial output [e-publication].
ISSN=1798-9272. December 2013,
Appendix figure 2. Seasonally adjusted change percentage of industrial output November 2013 /December 2013, TOL 2008
. Helsinki: Statistics Finland [referred: 25.7.2026].
Access method: http://stat.fi/til/ttvi/2013/12/ttvi_2013_12_2014-02-10_kuv_002_en.html