Published: 10 September 2015
Environmental taxes stayed nearly unchanged in 2013
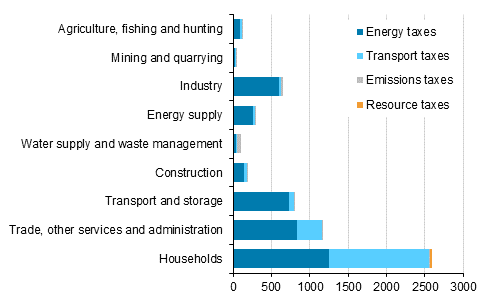
The total sum of environmental taxes in 2013 was EUR 5.9 billion. The increase from the year before amounted to 0.2 per cent. Households paid EUR 2.6 million of environmental taxes, that is, a share of nearly 47 per cent. Other major payers were manufacturing and service activities, particularly transport and storage. Taxation was mainly directed to production and use of energy, and vehicles. Emission taxes had a small share of environmental taxes.
Environmental taxes by industry and tax type in 2013, EUR million

Environmental taxes paid by manufacturing increased from the previous year by around eight per cent, while those paid by service activities declined by four per cent, which drop fully concerned the industry of transport and storage. Environmental taxes paid by households remained on level with the previous year.
Environmental taxes accounted for around seven per cent of the entire tax revenue of the state. The share is slightly higher than the average for EU countries.
Environmental taxes by industry and tax type in 2013, EUR million
| Industry (TOL 2008) | Energy taxes |
Transport taxes |
Emissions taxes |
Resource taxes |
Environmental taxes total |
| Agriculture, fishing and hunting | 58.8 | 18.9 | 0.0 | - 1) | 77.7 |
| Forestry | 35.9 | 4.4 | 0.2 | - | 40.4 |
| Mining and quarrying | 30.6 | 2.7 | 0.0 | - | 33.4 |
| Food industry | 18.5 | 1.8 | 0.0 | - | 20.3 |
| Forest industry | 49.6 | 2.2 | 0.4 | - | 52.1 |
| Manufacture of basic metals and metal products | 41.4 | 3.6 | 0.0 | - | 45.0 |
| Other manufacturing | 36.9 | 10.9 | 0.2 | - | 48.1 |
| Energy supply | 265.7 | 22.6 | 0.1 | - | 288.4 |
| Water supply and waste management | 40.5 | 7.0 | 56.0 | - | 103.5 |
| Construction | 141.0 | 39.7 | 0.1 | - | 180.8 |
| Trade | 119.2 | 61.1 | 0.3 | - | 180.5 |
| Land transport and transport via pipelines | 516.9 | 54.4 | 0.6 | - | 571.9 |
| Water transport | 104.4 | 0.2 | 0.0 | - | 104.7 |
| Air transport | 31.1 | 1.6 | 0.0 | - | 32.7 |
| Support activities for transportation, post | 75.3 | 6.1 | 0.3 | - | 81.8 |
| Real estate activities | 259.2 | 26.9 | 0.1 | - | 286.2 |
| Other service activities and administration | 454.5 | 235.0 | 3.0 | - | 692.5 |
| Households | 1251.8 | 1299.7 | 12.8 | 23.0 | 2587.2 |
| TOTAL | 3985.7 | 1799.8 | 101.9 | 23.0 | 5910.5 |
Environmental taxes are comprised of energy taxes, transport taxes, emission taxes and resource taxes. Most of environmental taxes are energy taxes on electricity and fuels. One-third of environmental taxes are transport taxes levied from different kinds of vehicles. The majority of emission taxes is waste tax. Taxes paid on carbon dioxide emissions are included in energy taxes. Licence fees for hunting and fishing are resource taxes in Finland.
Source: Environmental taxes 2013, by industry, Statistics Finland
Inquiries: Juuso Peltola 029 551 2330, Jukka Muukkonen 029 551 3224, ymparisto.energia@stat.fi
Director in charge: Ville Vertanen
Publication in pdf-format (250.5 kB)
- Tables
-
Tables in databases
Pick the data you need into tables, view the data as graphs, or download the data for your use.
Appendix tables
- Appendix table 1. Total environmental taxes by industry 2008-2013, EUR million (10.9.2015)
- Appendix table 2. Energy taxes by industry 2008-2013, EUR million (10.9.2015)
- Appendix table 3. Transport taxes by industry 2008-2013, EUR million (10.9.2015)
- Appendix table 4. Emission taxes by industry 2008-2013, EUR million (10.9.2015)
- Appendix table 5. Resource taxes by industry 2008-2013, EUR million (10.9.2015)
Updated 10.9.2015
Official Statistics of Finland (OSF):
Environmental and energy taxes [e-publication].
ISSN=2341-796X. by industry 2013. Helsinki: Statistics Finland [referred: 23.2.2026].
Access method: http://stat.fi/til/yev/2013/01/yev_2013_01_2015-09-10_tie_001_en.html

